























































AI in Power BI - Top Use cases and Best Practices
Quick Summary: Power BI uses AI to automatically point out patterns, identify anomalies, and create forecasts, providing analysts and executives with the insights necessary...


601 & 612, The Times square Arcade, Near Baghban party plot, Thaltej - Shilaj Road, Thaltej, Ahmedabad, Gujarat - 380059
Listening is fun too.
Straighten your back and cherish with coffee - PLAY !
Summarize this article with:



Sales Forecasting isn't optional anymore. Whether you are a startup or a mid-level enterprise, every decision you make today depends on how well you predict the future.
Instead of relying on assumptions, businesses like yours use sales forecasting to answer questions such as:
As per McKinsey & Company, SMEs that adopt advanced analytics and AI forecasting reduce prediction errors by 30–50%, leading to smarter business decisions and more efficient inventory management.
Microsoft Power BI, a leading business intelligence platform from Microsoft, supports advanced data analytics and AI-powered forecasting to help you explore predictive patterns & insights for accurate decision-making.
Let's move further and learn how to do sales forecasting using Power BI, understand the forecasting process, configuration, best practices, and practical scenarios that help you make more confident, data-driven decisions.
Power BI development helps sales teams overcome common challenges by combining AI forecasting, data analytics, and cloud dashboards into one platform.
Pipeline visibility: Tracks deal stages, conversion rates, and pipeline value with interactive visuals.
Forecast accuracy: Uses built in forecasting and DAX measures to compare projected vs. actual revenue.
Margin analysis: Reveals profitability by product, customer, or region, helping optimize pricing and discounts.
Rep performance: Leaderboards and KPIs highlight quota attainment, win rates, and coaching needs.
Cloud collaboration: Connects CRM/ERP data, shares dashboards securely, and enables mobile access for field teams.
Explore this to learn how to do custom forecasting in Power BI using DAX.
Sales forecasting isn't optional, it's survival. Build your custom Power BI Forecasting dashboard today with iFour's Power BI experts for hire.
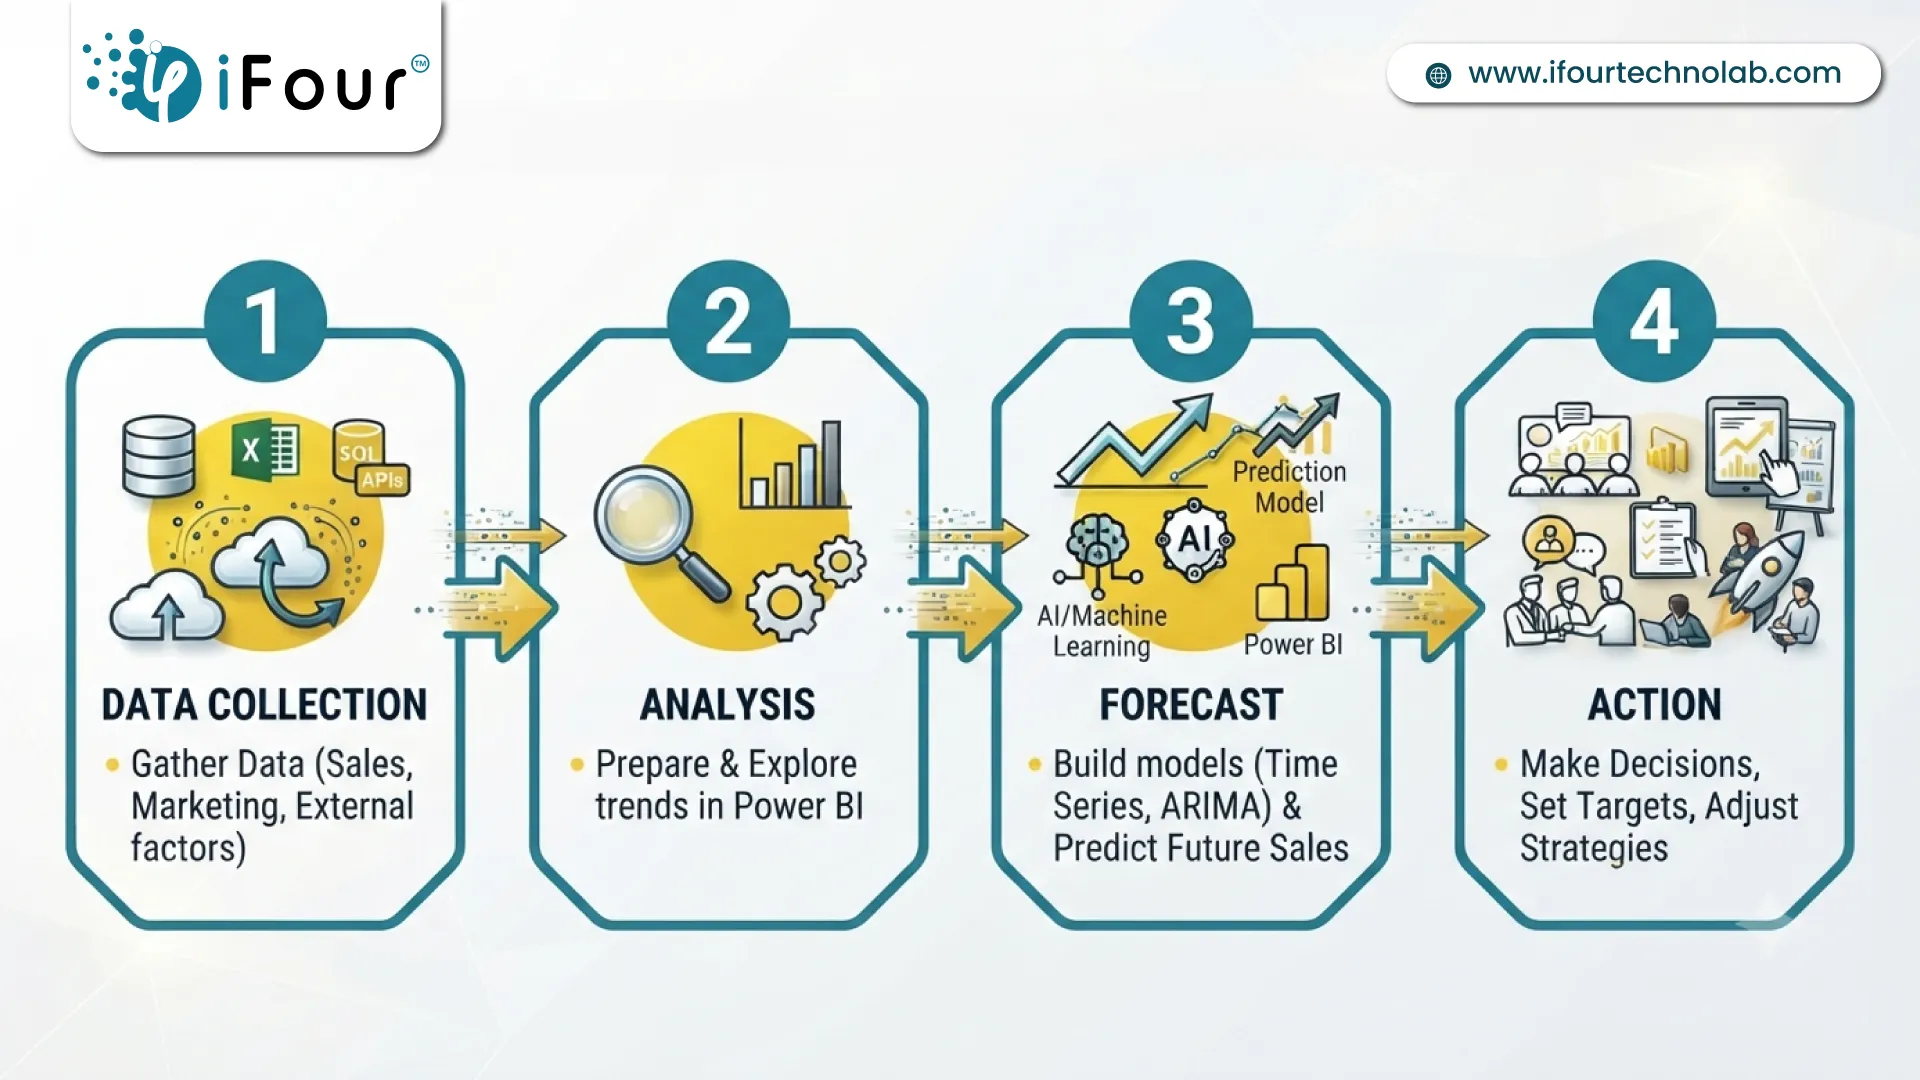
Image: How to do sales forecasting in Power BI
Here are the steps for Power BI Forecasting to follow:
Figure it out with our Power BI Migration Services
You can forecast sales in Power BI by building a line chart that uses a continuous date field on the X axis and total sales on the Y axis.
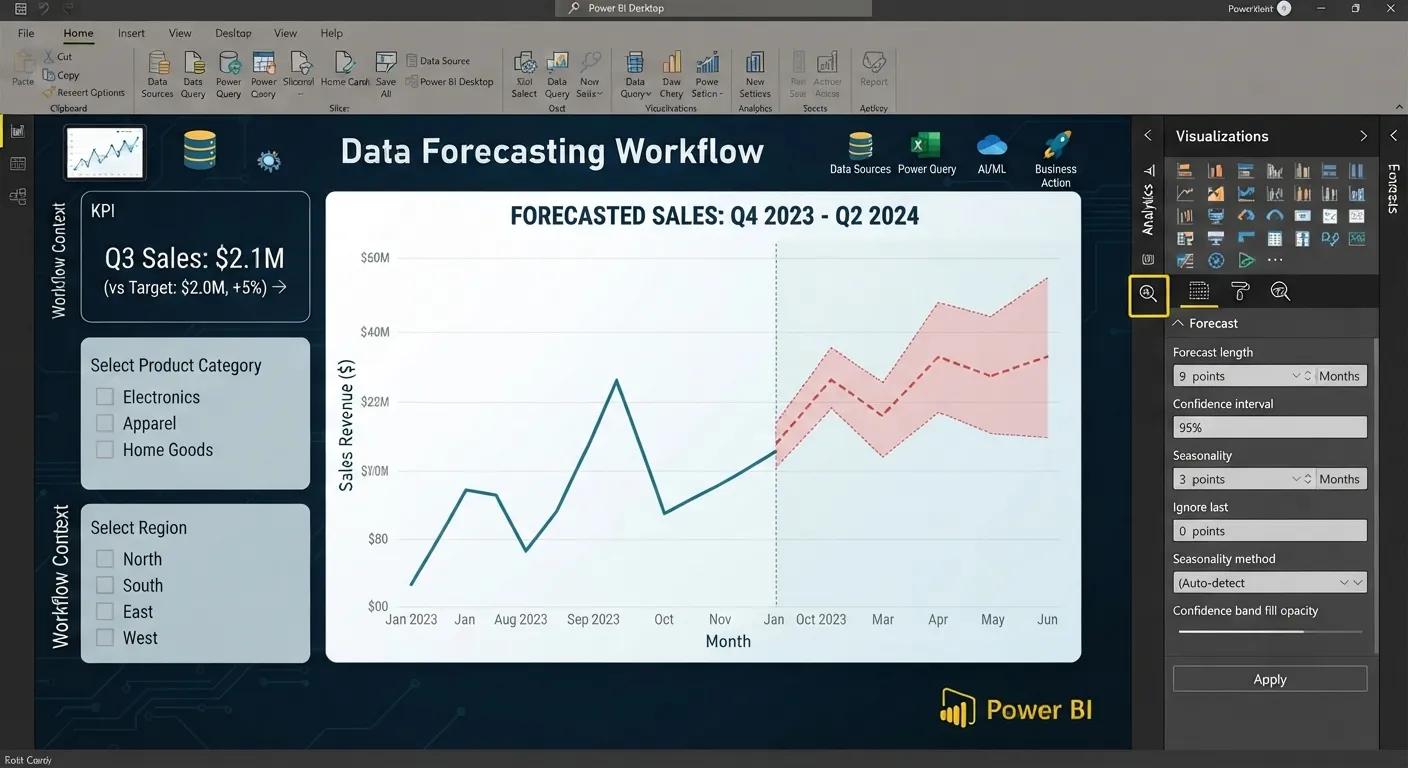
Next, open the Analytics pane, locate Forecast, choose Add, and fine tune the forecast length, units, and confidence interval to visualize future trends.
Data Preparation: Format your date column correctly and confirm sales values are numeric.
Access Analytics: Select the chart, click the magnifying glass icon, and open forecasting tools.
Add Forecast Layer: Adjust duration, seasonality, and confidence settings for precise predictions.
1. DAX Time Intelligence:
Apply functions like DATEADD to project historical sales forward. Explore: How to use DAX for custom forecasting in Power BI to learn in detail.
2. What If Growth Scenarios:
Use Modeling -> New Parameter to create a growth rate slider and multiply baseline sales by that variable for dynamic forecasting.
To learn what are what if parameters in Power BI forecasting, explore this blog.
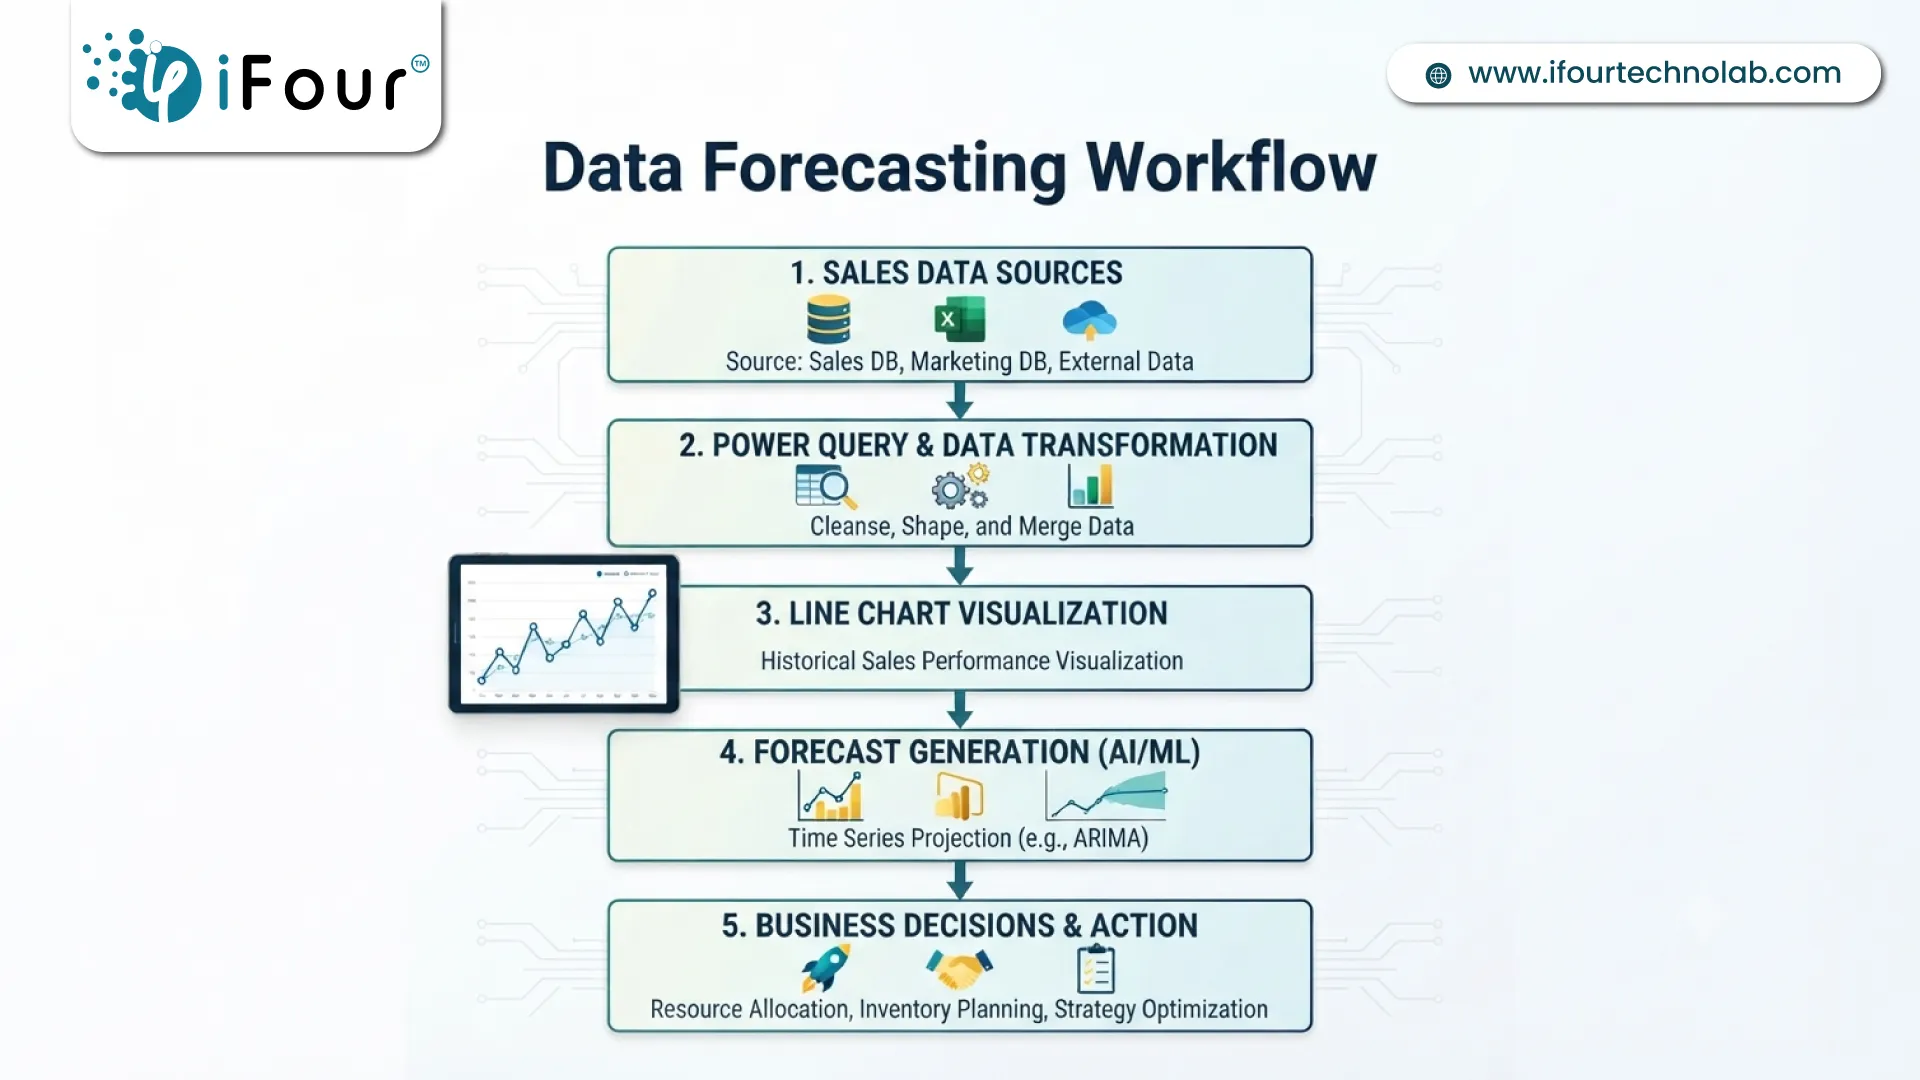
Microsoft Power BI includes AI-assisted analytics and statistical forecasting capabilities.
While its built-in forecasting primarily relies on time-series statistical methods, companies can integrate Power BI with Azure Machine Learning or Microsoft Fabric to develop more advanced predictive models.
Before creating a sales forecast, make sure your dataset meets certain quality standards. Forecasting models are only as reliable as the data they analyze.
The dataset should contain sufficient historical information to identify meaningful patterns.
Typical fields include:
| Required Field | Example |
|---|---|
| Date | 01-Jan-2025 |
| Product | Laptop |
| Region | North America |
| Sales Amount | $18,500 |
| Quantity Sold | 42 |
For businesses with seasonal demand, using at least 24 months of historical data generally provides better forecasting accuracy than relying on only a few months of records.
Also read: Demand Forecasting
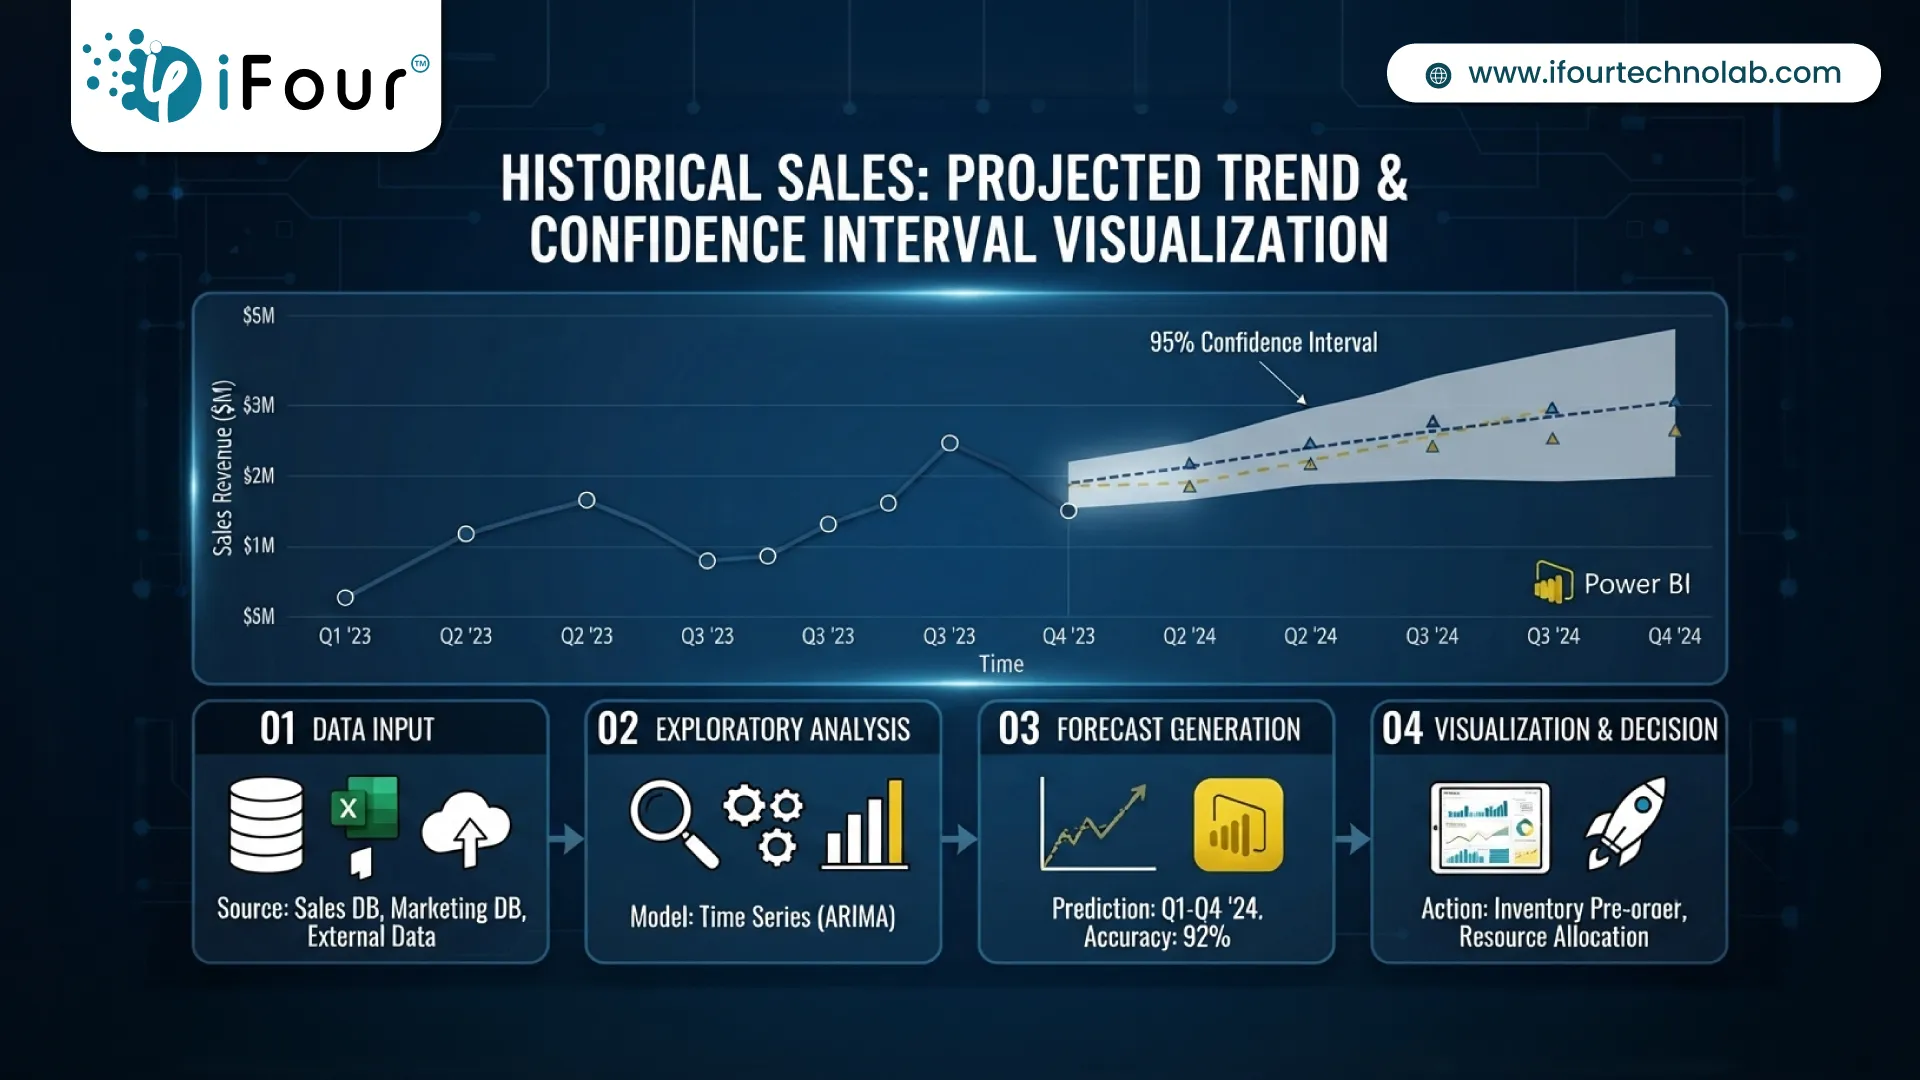
Your date column should use a proper Date or DateTime data type.
Avoid:
Example:
Not Recommended: 01/02/25, Feb-25, 2025/02/01
Recommended: 2025-02-01
A continuous timeline enables Power BI to detect trends more effectively.
Drive your business performance with real-time sales dashboard development services. .
Before building your forecast, verify that the dataset is free from:
Using Power Query simplifies these preprocessing tasks before visualization.
Power BI Forecasting works best when patterns already exist. For example:
| Business Type | Recommended Historical Data |
|---|---|
| Retail | 24–36 months |
| Manufacturing | 2–5 years |
| SaaS | 18–24 months |
| Healthcare | 2–3 years |
The longer and cleaner your history, the more reliable the forecast.
Expert Tip
Reviewed by Kishan Vaishnani, Power Platforms Project Manager, iFour:
"Many organizations focus on creating sophisticated dashboards but overlook data preparation. In practice, data cleaning and validation often account for the majority of the effort in analytics projects. Investing time in high-quality data significantly improves forecasting accuracy and business confidence."
Note:
If your organization is building an expansive Microsoft analytics ecosystem, it's also worth exploring iFour's blog on Power BI Dashboard Design Mistakes to Avoid.
While getting started, knowing what each setting does helps avoid confusion when configuring forecasts.
Defines how far into the future Power BI predicts. Examples:
Choose a duration aligned with your planning cycle rather than simply extending the forecast as far as possible.
This represents the range within which future sales are expected to fall. Common settings:
Higher confidence intervals produce wider forecast ranges because they account for greater uncertainty.
Turn healthcare data into decisions using our healthcare analytics services
Can Power BI forecast sales with seasonality? Yes, Power BI can:
Examples include:
When historical data clearly exhibits recurring patterns, specifying seasonality can improve forecast relevance.
Businesses sometimes experience unusual sales due to:
The Ignore Last option helps exclude incomplete or anomalous periods from influencing future projections.
Once the forecast appears, don't focus solely on the projected line. Instead, evaluate:
Overall Trend
Is sales growth increasing steadily?
Declining?
Remaining stable?
Confidence Band
A narrow confidence band indicates relatively stable historical patterns.
A wider band suggests greater uncertainty and potential volatility.
Seasonality
Look for recurring peaks and dips that align with known business cycles.
Outliers
Determine whether unusual historical events are influencing future predictions.
For example:
These events may not repeat and should be interpreted carefully.
Make faster calls with CEO dashboard development - built for clarity.
Power BI can deliver accurate forecasts, but it depends on the quality of your data. If the data is clean and shows clear patterns, such as trends or seasonality, the predictions will be more reliable.
Forecasting accuracy also depends on how far ahead you're trying to predict and what's happening around your business environment.
And here's the part most people often forget - you've to keep checking those forecasts against your actual sales. That regular validation, that little feedback loop, is what makes your future predictions sharper and more reliable.
Although requirements vary by industry, using 24 to 36 months of historical sales data generally enables more reliable trend and seasonal analysis. For instance:
Helpful Hint:
Avoid making predictions with insufficient data. Because Power BI algorithm requires enough historical data to identify reliable patterns. Provide at least two complete sales cycles, like two years of monthly data, to achieve a worthy outcome.
Let's understand how to forecast sales in Power BI with an example scenario.
Imagine an electronics retailer with three years of monthly sales data. The management team wants to answer three questions before the holiday season:
Using MS Power BI, the analyst:
Expected Result:
The forecast indicates a projected 22% increase in holiday sales compared to the previous quarter.
Upgrade your analytics with iFour’s flawless Power BI migration services
Based on these insights, the retailer:
Instead of reacting to demand after it occurs, the business plans proactively using data-backed forecasts.
Here is another example of Power BI predictive analytics for Sales
Note:
If you want to unlock the power of forecasting with Microsoft Excel and Power BI, then check out this video: How to Forecast Sales in Power BI Excel
Power BI is particularly effective when your organization needs to:
If your business relies on historical sales data and needs timely insights for planning, Power BI offers a practical and scalable forecasting solution.
In case your forecasting doesn’t work as expected, check this blog: Power BI forecast not showing solved!
| Factor | Details |
|---|---|
| Best for | Sales managers, business analysts, finance teams, operations leaders |
| Skill level | Beginner to Intermediate |
| Estimated setup time | 30–60 minutes (with prepared data) |
| Data required | Historical sales records with dates and sales values |
| Forecasting method | Built-in time-series forecasting in Power BI visuals |
| Business outcome | More accurate revenue planning and informed decision-making |
Expert Insight
Reviewed by Krunal Patel, Project Manager & BI Consultant (12+ Years of Experience), iFour:
"The quality of your forecast depends more on the quality of your data than the forecasting algorithm itself. Before creating forecasts in Power BI, ensure your historical sales data is clean, consistent, and spans enough time to capture seasonality. Even the most advanced analytics cannot compensate for incomplete or inaccurate data."
Yes. Power BI allows forecasts at multiple levels, including:
This flexibility supports both operational planning and executive reporting.
Understanding how Power BI generates forecasts helps you interpret the results correctly and avoid making business decisions based on incorrect assumptions.
Unlike basic trend charts, Power BI uses time-series forecasting to estimate future values based on historical patterns.
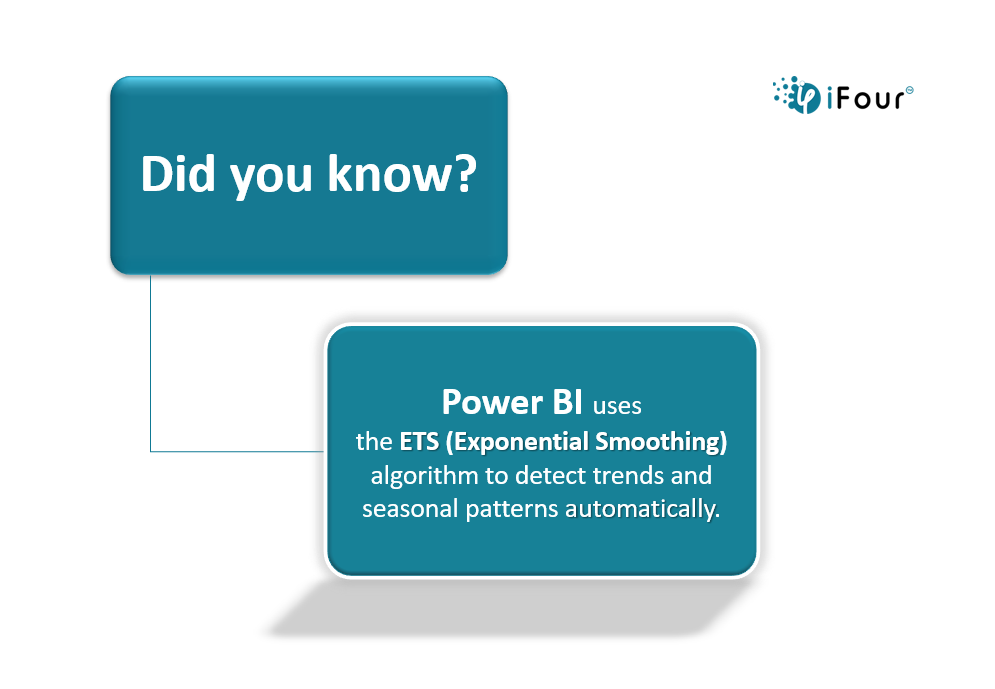
When you enable forecasting in a line chart, Power BI applies statistical models (based on exponential smoothing techniques) to detect trends and seasonality within your data.
To learn “how to create a forecast in Power BI line chart?” Click here.
Instead of simply extending a straight line, the model evaluates:
The output is a forecast line accompanied by an upper and lower confidence range, helping businesses understand both the expected outcome and the level of uncertainty.
Good to Know
Power BI's built-in forecasting feature is available for line charts using continuous date or time axes. For more advanced predictive models, organizations often integrate Power BI with Azure Machine Learning or Microsoft Fabric.
See this blog and learn how accurate is Power BI's built-in forecast
Microsoft Power BI helps you forecast sales by combining interactive visuals with AI powered analytics. This makes predictions much easier to understand and enables you to act upon them effectively.
Advantages of Power BI Forecasting:
Seamless data integration: Power BI connects multiple sources (ERP, spreadsheets, CRM) into one unified dashboard.
Visual Predictions: Line charts and forecasting visuals make trends clear for decision makers.
AI Forecasting Tools: Built in forecasting in the Analytics pane provides quick, reliable projections.
Custom DAX Models: Advanced users can design tailored scenarios using DAX functions.
Scenario Planning: What If parameters allow dynamic growth simulations and sensitivity analysis.
Collaboration & Sharing: Reports can be shared across teams, ensuring alignment on sales goals.
Scalability: Handles large datasets efficiently, making it suitable for both small practices and enterprise sales teams.
If you want to explore what are the steps to use the Analytics pane for forecasting - check this.
To decide Power BI vs Excel forecasting,
While debating “Is Power BI better than Excel for sales forecasting?”, the majority of users on Reddit agree with Microsoft Power BI, as it greatly improves efficiency for ongoing sales tracking – all through automated refreshes and dynamic drill-downs compared to static or manual reporting.
Also see this - how Power BI addresses spreadsheets challenges.
So, that's all from this blog on Power BI Predictive Analytics for Sales. Hope you found this helpful.
Sales forecasting is no longer limited to spreadsheets and manual estimates. As businesses generate more data, they need forecasting tools that can scale and provide clear, reliable insights.
Power BI brings data integration, visualization, and forecasting together in one platform. It helps teams identify trends, plan inventory, track performance, and make decisions based on data rather than guesswork.
That said, forecasting success depends on more than the tool itself. Clean historical data, regular validation, and business context all play a key role in improving forecast accuracy over time.
Whether you're setting sales targets, planning budgets, or shaping long-term strategy, Power BI can help you make more informed decisions with greater confidence.
If you're looking to build forecasting dashboards, connect data from multiple business systems, or strengthen your analytics capabilities, iFour can help you design and implement a Power BI solution that fits your business needs.
Sales forecasting is the process of estimating future sales revenue based on historical performance, current market conditions, customer demand, and business trends. It helps organizations anticipate future outcomes rather than reacting to them after they occur.
Instead of relying on assumptions, businesses use sales forecasting to answer questions such as:
Power BI complements rather than completely replaces Excel. Excel remains valuable for quick analysis and modeling, while Power BI excels in automated reporting, interactive dashboards, enterprise-scale data integration, and collaborative forecasting.
Yes, Microsoft Power BI is very relevant and holds a huge BI market share globally. It is a top tool for data modelling, secure enterprise reporting, and collaboration.
Although businesses have several analytics tools available, Power BI stands out because it combines data preparation, visualization, forecasting, and AI capabilities within a single ecosystem.
Instead of switching between spreadsheets, reporting tools, and statistical software, decision-makers can access everything from one centralized dashboard.
For organizations already using Microsoft technologies, Power BI integrates naturally with existing business systems, making implementation faster and more cost-effective.
Power BI sales forecasting is the process of analyzing historical sales data to predict future revenue, demand, or sales performance using statistical models and built-in forecasting capabilities. By identifying trends, seasonal patterns, and historical behavior, Power BI helps businesses make informed decisions about inventory, budgeting, staffing, and growth strategies.
Key Takeaways

A passionate Technical writer and an SEO freak working as a Content Development Manager at iFour Technolab, USA. With extensive experience in IT, Services, and Product sectors, I relish writing about Azure Cloud, Data Analytics, AI, & Workflow Automation and love sharing exceptional insights on various platforms. I believe in constant learning and am passionate about being better every day.


Access the Full EBook here!
Want Faster Power BI Reports?
This eBook shows you how.
Build Your Agile Team
Recent Posts

AI in Legal Practice: Powerful Use Cases Every Lawyer Should Know
September 10, 2026
How to Use Power BI for Sales Forecasting (Guide for CTOs)
August 06, 2026

AI in Power BI - Top Use cases and Best Practices
August 03, 2026


How to Build AI Agents: Strategic Guide for CTOs
March 31, 2026
Categories
Quick Summary: Power BI uses AI to automatically point out patterns, identify anomalies, and create forecasts, providing analysts and executives with the insights necessary...
Remember our last guide - Power BI forecasting? It revealed things that truly blocks accuracy, both structural and situational. Now it's time to take the next step. Knowing Power...
Did you know that 70% of CTOs (Chief Technology Officers) hesitate to adopt Microsoft Power BI because of its myths and misconceptions that float around. What they fail to see is...

Get this Demo!
Get this Demo!
Get this Demo!
Get this Demo!
Get this Demo!
Get this Demo!