4 Types of Healthcare Analytics with Examples & Success Stories
You already know how healthcare creates tons of clinical data every day. Patient visits… Labs… EMRs… doctor portals… scheduling systems… everything is generating numbers nonstop. But...
Listening is fun too.
Straighten your back and cherish with coffee - PLAY !
It’s difficult to believe, but there are about 426 Business Intelligence tools available! And the leaders in this field are Tableau, holding a 12.37% market share, and Power BI, which has a 6.94% market share.
Even with so many tools available, deciding which BI software to pick remains a major challenge for CTOs.
Here are the pain points CTOs actually face with BI Reporting:
To simplify their concerns, we have brought the list of 13 BI reporting tools to help them with data visualization and analysis.
Here’s the narrowed down of 13 business intelligence reporting tools that assist in converting raw data into actionable insights. However, it remains essential for you to determine which tool is most suitable for data visualization and decision-making.
Explore further, check out the details and decide the right one.
A Microsoft-powered BI tool designed for enterprises, offering deep integration with the Microsoft ecosystem. This is best to go with for CTOs who rely on Microsoft 365 development services.
Compatibility: Works seamlessly with Excel, Azure, Dynamics 365, SQL Server, and other Microsoft tools.
Ease of Integration: Smooth integration with third-party apps like Salesforce and Google Analytics.
Hire Power BI developers from iFour to build custom visuals.
Interface: Intuitive, drag-and-drop functionality with a clean UI.
Accessibility: Easy for non-technical users with natural language query support.
Real-Time Insights: Near real-time reporting capabilities.
Scalability: Scales well with Azure cloud services.
Data Security: Role-based access, data encryption, and Microsoft’s advanced security.
Regulatory Compliance: Meets GDPR, HIPAA, and ISO standards.
Take a look at these prime Power BI use cases we've crafted for our industry CTOs. These BI examples helped them simplify their operational decisions!
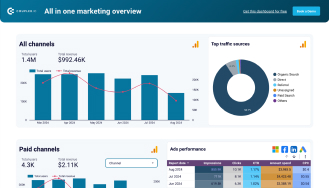
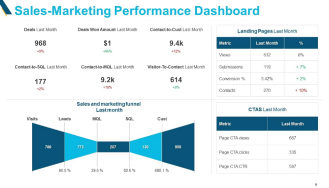
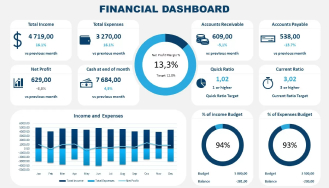
Pricing Model: Pro ($10/user/month) and Premium (varies based on capacity).
Value for Money: Affordable for small businesses, but Premium is costly for larger deployments.
Customer Support: Microsoft support with extensive community forums.
Training and Documentation: Rich documentation, free courses, and Power BI community support.
Industry Applications: Finance, retail, healthcare, and manufacturing.
Success Stories: Coca-Cola improved its sales analytics with Power BI dashboards.
Advantages: Best for Microsoft users, affordable, strong visualization.
Limitations: Limited multi-cloud support, requires Power BI Premium for large datasets.
A leading BI tool known for its advanced visualizations and interactive dashboards
Drag-and-drop reports, AI-driven analytics, and strong data storytelling.
Compatibility: Works with AWS, Google Cloud, Microsoft Azure, and 100+ data sources.
Ease of Integration: Straightforward but requires connectors for real-time data updates.
Interface: Highly interactive but has a learning curve.
Accessibility: Designed more for analysts than business users.
Real-Time Insights: Near real-time reporting.
Scalability: Handles large datasets but needs strong infrastructure.
Data Security: Role-based access and data encryption.
Regulatory Compliance: Supports SOC 2, GDPR, and HIPAA compliance.
Pricing Model: Subscription-based (starting at $70/user/month).
Value for Money: Expensive but offers best-in-class data visualizations.
Customer Support: Premium support available, strong user community.
Training and Documentation: Paid training and Tableau Public resources.
Industry Applications: Retail, government, financial services.
Success Stories: Nike uses Tableau for supply chain analytics.
Advantages: Best for data visualization, integrates well with cloud platforms.
Limitations: High pricing, steep learning curve.
Move your business analytics effectively with Power BI Migration services
A Google Cloud BI tool specializing in deep analytics and real-time insights.
Compatibility: Best with Google Cloud, BigQuery, AWS, Snowflake.
Ease of Integration: Easy for Google Cloud users, but others may need extra setup.
Interface: Clean, but requires SQL knowledge.
Accessibility: More suited for technical teams than business users.
Real-Time Insights: Excellent for live querying.
Scalability: Handles big data well with BigQuery.
Data Security: Role-based security, Google Cloud security.
Regulatory Compliance: Compliant with GDPR, HIPAA.
Looker Pricing Model: Custom pricing based on usage.
Value for Money: Better for large enterprises, not SMBs.
Customer Support: Google Cloud support, community forums.
Training and Documentation: Good Google training resources.
Industry Applications: Marketing, e-commerce, technology.
Success Stories: BuzzFeed uses Looker for audience insights.
Advantages: Strong for data modeling, deep analytics.
Limitations: Requires SQL knowledge, costly.
A cloud-based BI tool focused on executive-level dashboards and use cases.
Compatibility: Works with Salesforce, Google Analytics, AWS, SAP.
Ease of Integration: Easy plug-and-play for cloud data.
Interface: User-friendly for executives.
Accessibility: No SQL is required, making it ideal for business users.
Real-Time Insights: Strong real-time updates.
Scalability: Handles large datasets but is costly for scaling.
Data Security: Encrypted data, role-based access.
Regulatory Compliance: Complies with GDPR, HIPAA.
Pricing Model: Subscription-based, custom pricing.
Value for Money: Expensive but ideal for executives.
Customer Support: 24/7 support for enterprise users.
Training and Documentation: Comprehensive training programs.
Industry Applications: Healthcare, finance, retail.
Success Stories: Cisco uses Domo for executive insights.
Advantages: User-friendly, real-time dashboards.
Limitations: High cost, not ideal for deep data analysis.
Drive innovation and efficacy with our Power Platform consulting services .
A self-service BI tool known for AI-driven insights and powerful data exploration.
Associative data model, AI-powered insights, real-time collaboration, interactive dashboards.
Compatibility: Works well with AWS, Azure, Google Cloud, Snowflake, SAP, and databases like Oracle and SQL Server.
Ease of Integration: Fast data integration, supports both on-premises and cloud environments.
Interface: Modern, intuitive UI, but can be overwhelming for beginners.
Accessibility: Strong for data analysts, but less user-friendly for non-technical users.
Real-Time Insights: Fast in-memory processing enables real-time data exploration.
Scalability: Scales efficiently for both small and large enterprises.
Read More: How to Export Power BI Data to Excel
Data Security: Strong encryption, role-based access, and centralized governance.
Regulatory Compliance: Meets GDPR, HIPAA, and SOC 2 standards.
Pricing Model: Subscription-based, with a free version for individuals and small teams.
Value for Money: Good for enterprises needing AI-driven analytics but costly compared to alternatives.
Customer Support: Premium support available, plus an active user community
Training and Documentation: Extensive learning materials and Qlik Sense certification programs.
Industry Applications: Healthcare, retail, finance, and supply chain management.
Success Stories: Novartis uses Qlik Sense for pharmaceutical data analytics.
Here’s a well-explained tutorial on building a healthcare data analytics dashboard.
Advantages: AI-powered insights, strong data exploration, flexible deployment.
Limitations: High learning curve, expensive for small businesses.
Build your apps in no time with Low code app development services
A BI tool specialized in embedded analytics, allowing businesses to integrate insights directly into their applications.
AI-powered analytics, real-time data dashboards, and robust API support for seamless embedding.
Compatibility: Works with AWS, Google Cloud, Azure, Snowflake, and databases like PostgreSQL and SQL Server.
Ease of Integration: Best for embedding analytics into existing software, requires API knowledge for full customization.
Interface: Highly customizable UI, but requires some technical expertise.
Accessibility: Designed for developers and enterprises, not ideal for casual business users.
Real-Time Insights: Fast processing speeds, handles streaming data efficiently.
Scalability: Scales well for SaaS applications and enterprise-level use cases.
Data Security: Granular access control, encryption, and advanced security settings.
Regulatory Compliance: Meets GDPR, HIPAA, and ISO security standards.
Pricing Model: Custom pricing, based on deployment and user requirements.
Value for Money: Expensive but ideal for companies embedding BI into their products.
Customer Support: Dedicated support team with enterprise SLAs.
Training and Documentation: Extensive API documentation and developer support.
Industry Applications: SaaS companies, finance, healthcare, manufacturing.
Success Stories: Philips Healthcare uses Sisense for real-time health data analytics.
Advantages: Best for embedded analytics, AI-powered insights, high customization.
Limitations: Not beginner-friendly, requires API knowledge.
Build cloud-based apps securely with our Azure App Development Services
A BI platform focused on security, AI-driven insights, and enterprise-level analytics.
HyperIntelligence (AI-driven insights), strong security features, scalable reporting.
Compatibility: Works with AWS, Azure, Google Cloud, Oracle, SAP, and major databases.
Ease of Integration: Smooth integration with enterprise applications but requires technical expertise.
Interface: Feature-rich but complex, best for IT-managed BI teams.
Accessibility: Not beginner-friendly, requires some training.
Real-Time Insights: Supports AI-powered insights in real-time.
Scalability: Highly scalable for large enterprises.
Data Security: Strong access control, encryption, and enterprise security features.
Regulatory Compliance: Meets GDPR, HIPAA, and SOC 2 compliance standards.
Pricing Model: Subscription-based, custom pricing for enterprise needs.
Value for Money: Great for large enterprises, but expensive.
Customer Support: Premium enterprise support available.
Training and Documentation: Comprehensive learning resources and certifications.
Industry Applications: Government, healthcare, financial services.
Success Stories: Lowe’s uses MicroStrategy for retail performance analytics.
Advantages: AI-driven insights, strong security, scalable.
Limitations: Complex interface, high cost.
A BI tool powered by IBM AI, offering deep insights for enterprises.
AI-driven reporting, data visualization, predictive analytics.
Compatibility: Works well with IBM Cloud, AWS, Azure, and enterprise databases.
Ease of Integration: Best for IBM ecosystem users, but external integrations can be challenging.
Interface: Feature-packed but not very modern.
Accessibility: Best for enterprise analysts, not business users.
Integrate your business analytics with our API integration services
Real-Time Insights: Strong AI-driven real-time analytics.
Scalability: Scales well for large enterprises.
Data Security: Robust security layers, role-based access, and encryption.
Regulatory Compliance: Meets GDPR, HIPAA, and ISO security standards.
Pricing Model: Subscription-based, custom enterprise pricing.
Value for Money: Good for enterprises, but not ideal for small businesses.
Customer Support: IBM offers dedicated enterprise support.
Training and Documentation: Extensive training programs and certifications.
Industry Applications: Banking, government, healthcare.
Success Stories: Amica Insurance improved claims processing with Cognos.
Advantages: AI-driven insights, enterprise-grade security.
Limitations: Dated UI, expensive for smaller businesses.
A cost-effective BI tool designed for small and mid-sized businesses looking for easy-to-use reporting.
Compatibility: Connects with Zoho CRM, Google Analytics, Salesforce, AWS, and various databases.
Ease of Integration: Easy setup with built-in integrations, but limited customization for complex use cases.
Interface: User-friendly and minimalistic, designed for non-technical users.
Accessibility: Great for small teams, but lacks advanced analytics for large enterprises.
Real-Time Insights: Near real-time reporting, but may lag with large datasets.
Scalability: Best for small businesses, may not scale well for enterprises.
Data Security: Basic encryption and role-based access control.
Regulatory Compliance: Meets GDPR and ISO standards but lacks HIPAA compliance.
Pricing Model: Affordable plans (starting at $30/month for 2 users).
Value for Money: Best value for small businesses but lacks enterprise-grade capabilities.
Make optimal business decisions with our CEO dashboard development services
Customer Support: Email and chat support, but limited compared to enterprise solutions.
Training and Documentation: Extensive help articles, webinars, and Zoho community.
Industry Applications: Startups, e-commerce, small businesses.
Success Stories: KPMG India uses Zoho Analytics for HR and finance reporting.
Advantages: Affordable, easy to use, great for SMBs.
Limitations: Limited scalability, not suitable for AI-heavy analytics.
A powerful BI tool for real-time analytics and predictive insights.
Compatibility: Works with AWS, Azure, Google Cloud, SAP, and big data platforms.
Ease of Integration: Good cloud support, but requires setup for advanced integrations.
Interface: Feature-rich but complex, built for power users.
Accessibility: Better for data analysts than business users.
Real-Time Insights: Strong real-time analytics, great for IoT and financial data.
Scalability: Enterprise-grade scalability, suitable for big data workloads.
Data Security: Robust security features, role-based access control.
Regulatory Compliance: Meets GDPR, HIPAA, and SOC 2 standards.
Pricing Model: Subscription-based, enterprise pricing.
Value for Money: High cost but excellent for large-scale real-time analytics.
Customer Support: Enterprise-grade 24/7 support.
Training and Documentation: Extensive documentation, webinars, and TIBCO community.
Industry Applications: Healthcare, finance, manufacturing.
Success Stories: Airbus uses TIBCO Spotfire for predictive maintenance.
Advantages: Best for real-time data, strong analytics.
Limitations: High learning curve, expensive for small businesses.
Manage your sales process smoothly with MS Dynamic 365 development services
A SQL-based BI tool for data teams, offering deep analytical insights.
Compatibility: Works with AWS, Google Cloud, Snowflake, Redshift, and databases.
Ease of Integration: Great for SQL-based teams, but limited no-code integrations.
Interface: SQL-driven, minimalist UI.
Accessibility: Best for data teams, not ideal for non-technical users.
Real-Time Insights: Fast querying for structured data.
Scalability: Handles large datasets efficiently.
Data Security: Encryption, access control, enterprise-level security.
Regulatory Compliance: Meets SOC 2, GDPR compliance.
Pricing Model: Custom pricing, pay-as-you-go model.
Value for Money: Great for data-driven companies, but not beginner-friendly.
Customer Support: Email and chat support.
Training and Documentation: Good documentation but no beginner-friendly tutorials.
Industry Applications: Tech startups, e-commerce, SaaS.
Success Stories: Shopify uses Mode for real-time sales analytics.
Advantages: Great for data teams, flexible SQL analysis.
Limitations: Not no-code friendly, limited support for casual users.
A BI solution for enterprises leveraging Oracle’s ecosystem.
Compatibility: Best for Oracle Cloud, SAP, AWS, and enterprise databases.
Ease of Integration: Smooth for Oracle users, but complex for others.
Interface: Enterprise-level UI, not the most intuitive.
Accessibility: Better for IT teams than business users.
Real-Time Insights: AI-powered analytics, real-time dashboards.
Scalability: Highly scalable, but best for Oracle cloud users.
Want to migrate from AWS to Azure ? Hire our cloud experts.
Data Security: Enterprise-grade security, strong compliance standards.
Regulatory Compliance: Meets GDPR, HIPAA, and SOC 2.
Pricing Model: Custom pricing, enterprise-level costs.
Value for Money: Best for Oracle-heavy enterprises, costly for others.
Customer Support: Premium enterprise support.
Training and Documentation: Oracle University training available.
Industry Applications: Finance, supply chain, retail.
Success Stories: FedEx uses Oracle Analytics for logistics optimization.
Advantages: Great for Oracle users, AI-driven insights.
Limitations: High cost, complex setup.
A BI tool designed for large enterprises, focusing on data governance and reporting.
Compatibility: Best with SAP HANA, Oracle, AWS, Azure.
Ease of Integration: Smooth for SAP users, complex for others.
Interface: Complex but powerful.
Accessibility: Best for enterprise IT teams.
Real-Time Insights: Great for enterprise reporting.
Scalability: Highly scalable for multinational organizations.
Data Security: Advanced governance and encryption features.
Regulatory Compliance: Meets GDPR, HIPAA, SOC 2.
Pricing Model: Enterprise pricing, custom quotes.
Value for Money: Best for enterprises, expensive for SMBs.
Customer Support: SAP enterprise support.
Training and Documentation: Extensive documentation and SAP Learning Hub.
Industry Applications: Banking, healthcare, government.
Success Stories: Siemens uses SAP BusinessObjects for global reporting.
Advantages: Best for enterprise reporting, and strong data governance.
Limitations: Not user-friendly, high cost.
Before you choose any BI tool, ask yourself these questions:
Once you get answers to this, you are good to go with a BI tool that aligns with these aspects.
Whether it is Power BI or Tableau, Demo or Qlik Sense, or any other - choosing the right BI tool can change the game of your business, be it healthcare, fintech, legal, or any other.
Despite there are number of tools that transform raw data into powerful insights, there are certain aspects and requirements CTOs need to consider before choosing. Once they get answers to their necessities, it becomes easy for them to pick the best one.
This blog discussed the best BI Reporting tools for CTOs. We hope you find this helpful and informative. Need assistance in picking the right BI tool? Contact us and get rid of managing scattered, inconsistent, and delayed data with iFour’s Dashboard development services .
So, that’s all about Azure Databricks vs Azure Synapse Analytics. We hope you found this helpful. If you are looking to migrate your AWS workflows to Azure or you want to learn more about our Azure migration services, do not hesitate to contact us. We are just a click away!
(Turning insights into various data visualizations)
Assessing Business Goals: Aligning BI capabilities with strategic objectives.
Evaluating Total Cost of Ownership (TCO): Balancing licensing, training, and maintenance costs.
Considering Adoption & Training Needs: Ensuring seamless rollout across teams.
Long-Term ROI: How BI tools contribute to growth, efficiency, and decision-making.
Creating a report in business intelligence is pretty straightforward. Here’s a simple guide:
This eBook shows you how.
You already know how healthcare creates tons of clinical data every day. Patient visits… Labs… EMRs… doctor portals… scheduling systems… everything is generating numbers nonstop. But...

Let’s keep it simple. In healthcare, trust, safety, and human dignity come first, no matter what solution you build. The same applies to AI. Today, it is everywhere, from clinics...

Let's keep it real. The whole point of building autonomous Agents is to cut manual work and keep focus on business. Approvals that used to take days can happen in hours because...