You will be surprised to know that 90% of the data in the world has been created in just the last two years. That's roughly 74x times the increase compared to 2010 (when the world had only 2 zettabytes of data). Mind-blowing!
What’s even more shocking is its prediction which could hit 181 zettabytes by 2025. Now just think about the significant loss businesses would face if they couldn't tap into the vital insights buried in their big data.
Moving with advancement and adopting the right tool to efficiently extract actionable insights is a smart move to deal with this.
Power BI and Tableau – the two leaders in data visualization and business intelligence, evolved significantly over the years and have become the go-to choices for C-level executives.
With a range of exceptional features and tremendous capabilities in each, it can be tough to decide which one is the best fit for a CTO.
So, here we will delve deeper and simplify this fact with detailed comparisons and insights, helping you make an ideal decision for your unique requirements. Let’s begin with the Tableau vs Power BI market share.
What is the market share of Power BI?
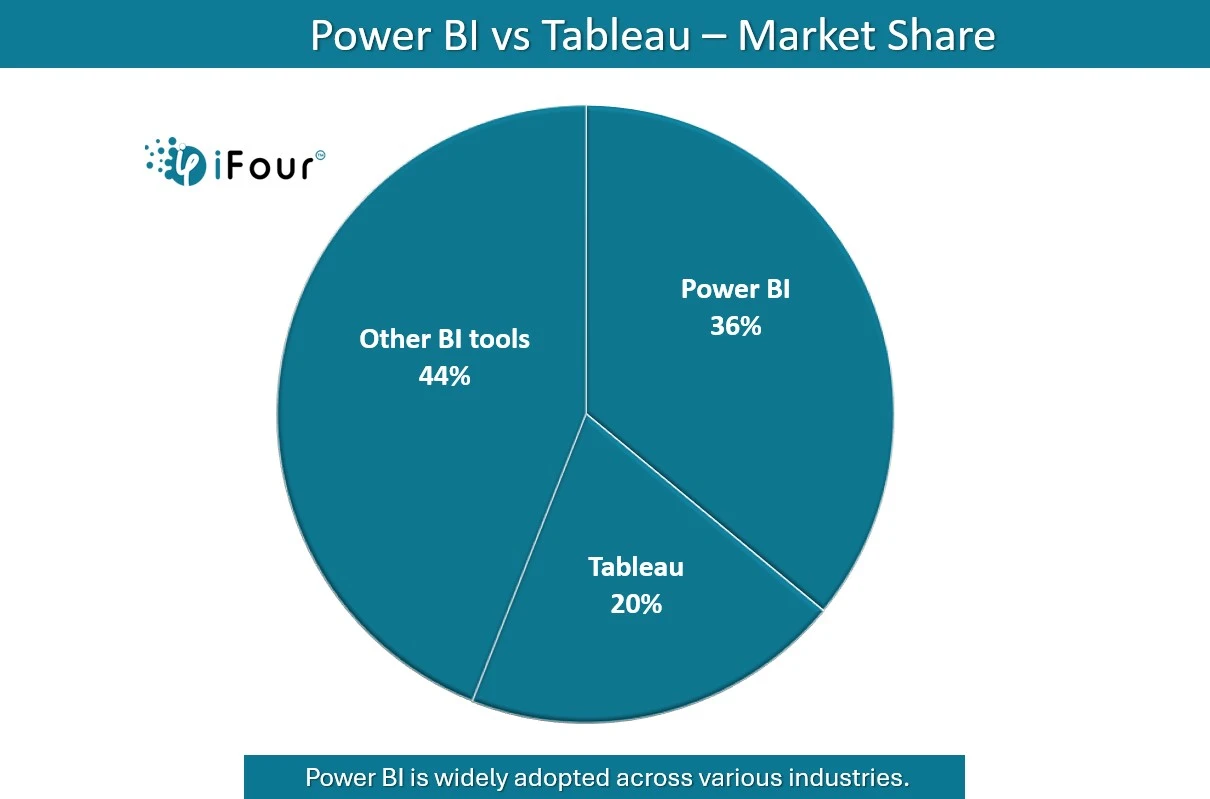
As per reports, Power BI holds a significant market share of 36% in the business intelligence tool category. Power BI has a broad range of user base across multiple industries and businesses of all ages are constantly adopting it.
What is the market share of Tableau?
A quite old player in the market as compared to Power BI, Tableau has remained a popular choice in the BI market. Tableau ranked second in the business intelligence tool category with an estimated market share of 20% .
You can see that both tools are quite popular in the market and have certain advantages over each other which creates great confusion in choosing to select the right tool.
To overcome this dilemma, let’s explore features and disparities between these two tools as shown below.


