Excel vs Power BI : When to Use What?
Let’s consider Power BI vs Excel features comparison, the following prospects will help you decide the best tool.
Power BI vs Excel: Data Visualization
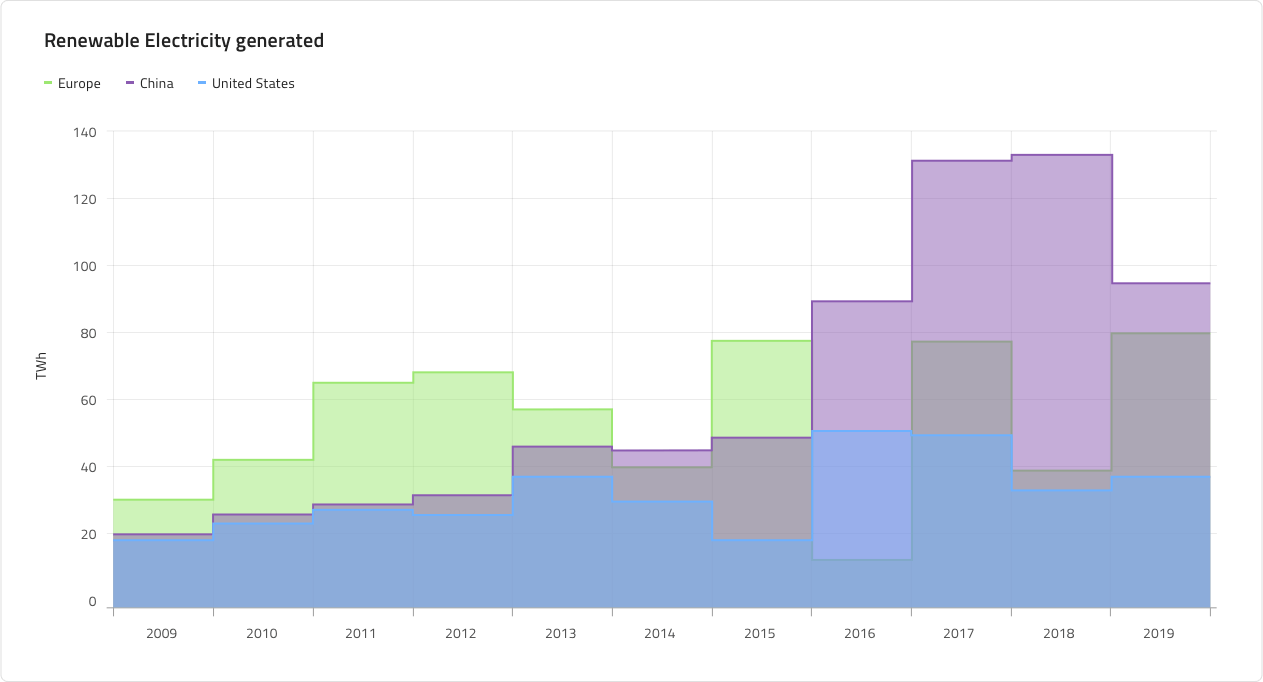
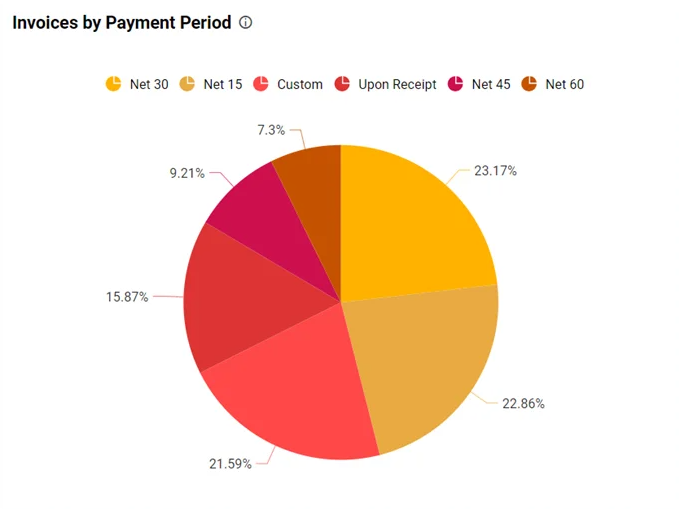
To decide in Power BI vs Excel - which is better for data visualization we have to check whether both tools offer visualization options or not. Well, Power BI and Excel both have some common components for visualization like bar charts, pie charts, and line charts.
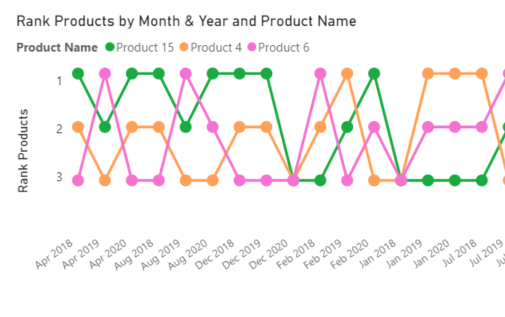
With Power BI you will get a huge selection of visuals and custom visuals available in AppSource. Yes, Power BI enables you to customize charts to make them look more dynamic.
Power BI vs Excel: Data Handling
Power BI and Excel both are business intelligence tools that help businesses collect and analyze data. The main contrast between Power BI vs Excel relies on its data handling capabilities. Power BI connects directly to datasets and data sources to extract large amounts of data. The data modeling capabilities of Power BI allow you to transform and shape your data. Hence, we can say, that Power BI is a more advanced tool for data handling and visualization.
Power BI vs Excel: Data Integration
Power BI allows seamless integration with multiple data sources, while the data integration capabilities in Excel are much more limited. Excel do supports various data sources, although it may require some manual effort.
When your organization deals with large data sets from different departments like sales, marketing, and finance, then opt for using Power BI instead of Excel. With Power BI you can even clean and transform data using Power Query. Comparing Power BI vs Excel integration scenarios, Power BI ranks higher.
Power BI vs Excel: Customization
Both tools are flexible and provide a certain level of customization capability. Such as in Excel you can customize formatting, formulas, charts, graphs, PivotTables, PivotCharts, etc. Moreover, you can also create custom functions for task automation. Talking about Power BI, here you can have huge customization power. Such as it provides customized visualization for charts, maps, graphs, data tables, themes, templates, and more. So, this depends on your certain customization needs to choose from Power BI vs Excel.
Power BI vs Excel: Advanced Analytics
In Power BI vs Excel comparison, Power BI avails robust features like predictive analysis and machine learning incorporation for advanced analysis. Power BI even updates data automatically in real time for better data analysis.
Talking about Excel, it lacks such features, making it a less likely choice for advanced analytics. You cannot automate operations in Excel sheets except for calculation and pivot tables. Using Excel, you will not get accurate outcomes for advanced analytics.
Power BI vs Excel: Cloud Integration
Power BI seamlessly integrates with cloud services like Azure which allows you to access data storage and processing more effortlessly. While Excel has some limited cloud integration capabilities. In Power BI you can even publish the report to stakeholders with Microsoft’s cloud-based services. While in Excel you have to rely on email or other sharing tools.
So, when the majority of your data is stored in cloud storage then it is ideal to work with Power BI. Or else if you have limited cloud integration needs, then Excel can be a suitable tool.
These are the basic components that will help you select when to use Power BI over Excel.


