Microsoft Excel is an extensively used tool in the financial business for doing sophisticated calculations, analyzing data, and producing business reports. Because standard Excel software can only help with basic operations, businesses require a platform that can extend Excel functionality and boost business productivity. This is where Excel add ins development comes into play.
What is an Excel Add-in?
Excel add-ins are software programs that extend the capabilities of Microsoft Excel across various platforms, including Mac and Windows, to make it more powerful, efficient, and user-friendly. These custom Excel Add-ins are created by software gurus who use scripting and advanced formulae to make them perform bizarre things.
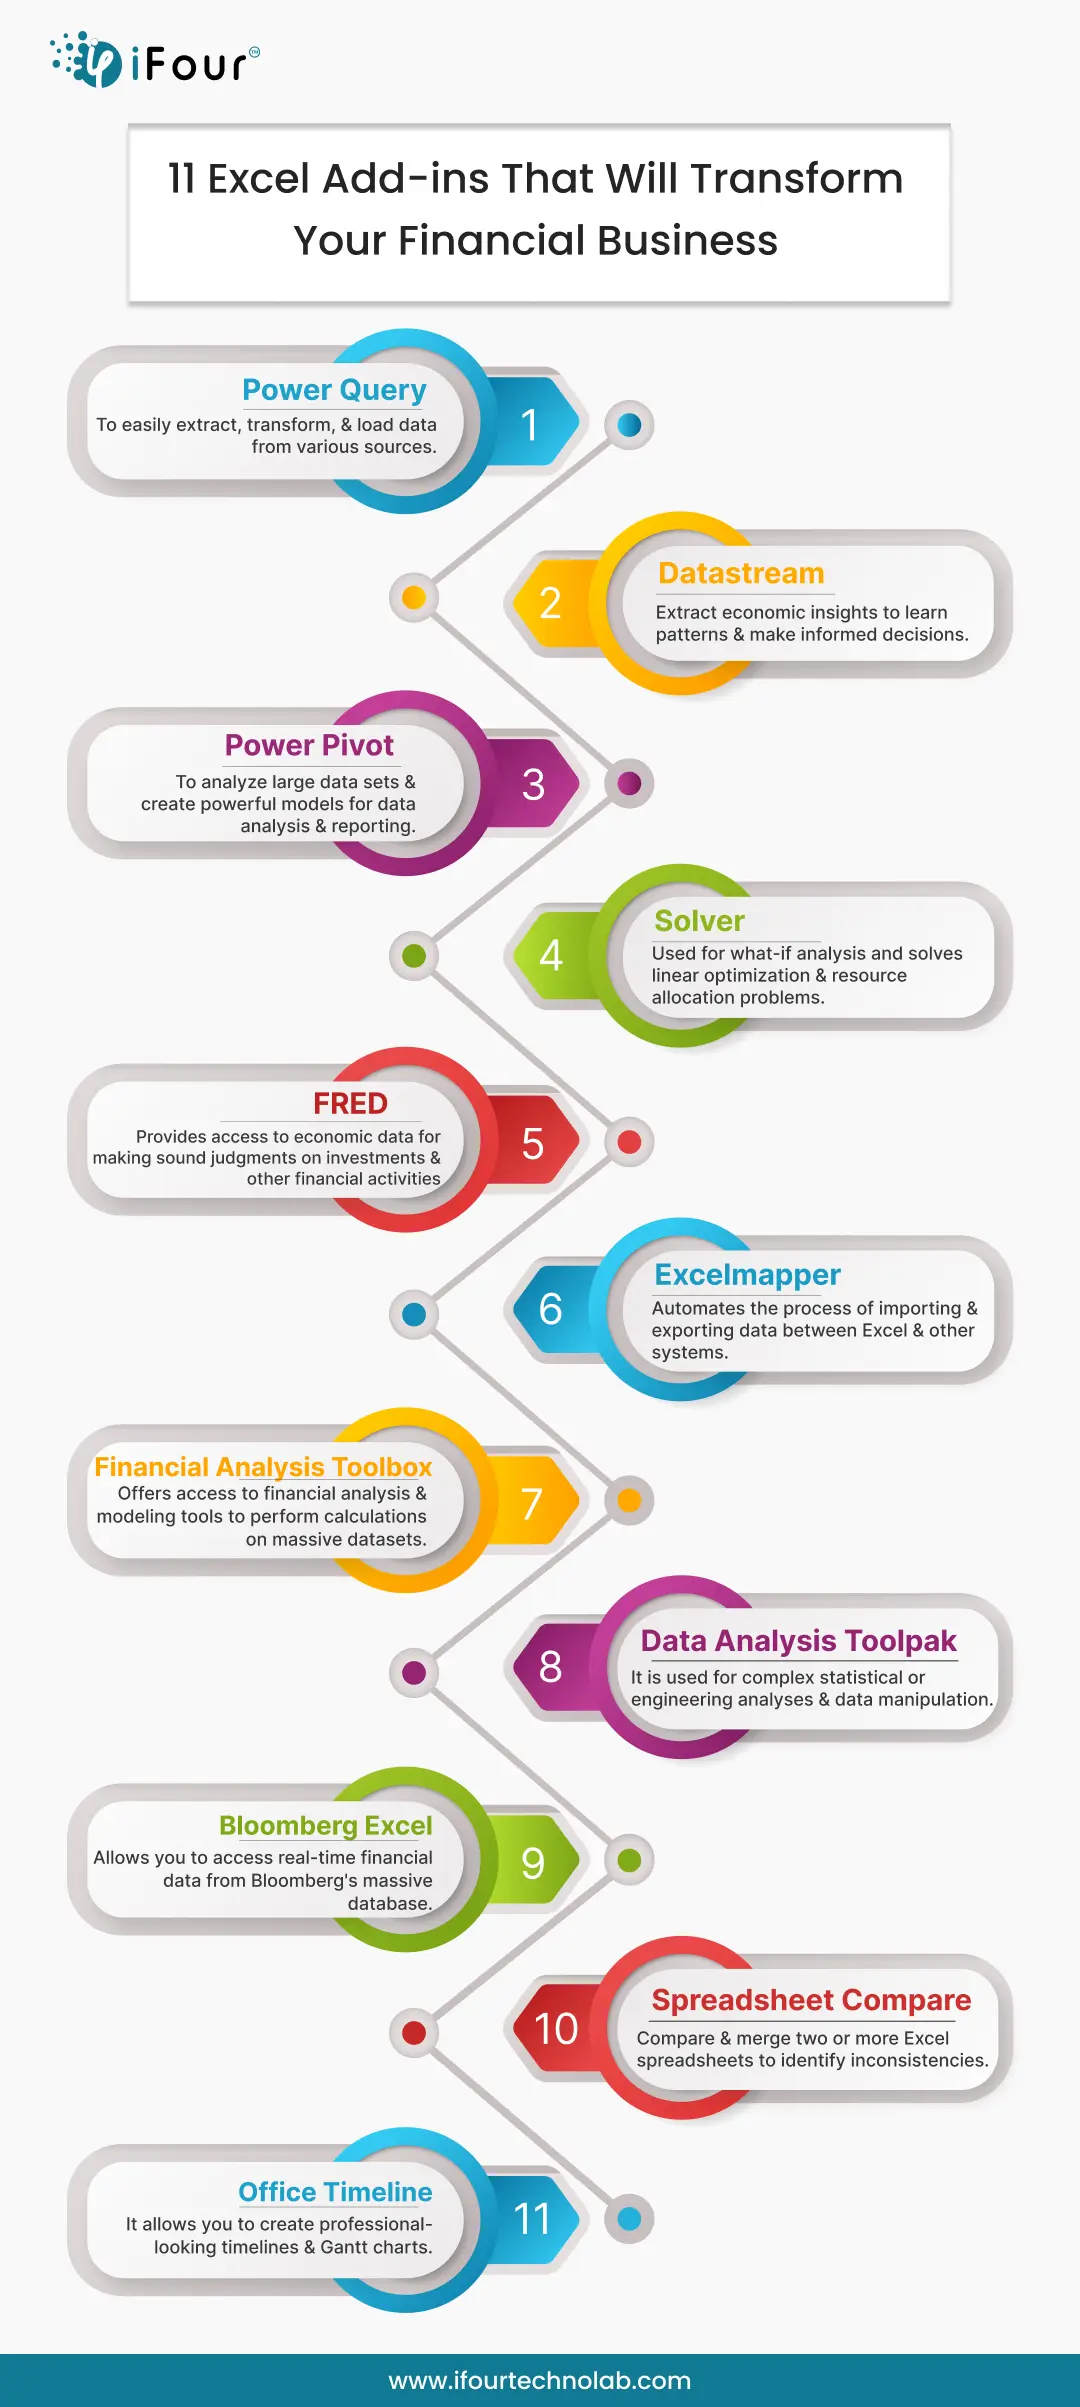
In this blog, we will discuss the top 11 Excel add-ins that financial experts and software developers can use to boost productivity and streamline their workflows.
1. Power Query
Power Query is an Excel add-in that allows users to easily extract, transform, and load data from various sources. With Power Query, users can connect to a wide range of data sources, including databases, web pages, and files, and then clean and transform the data to prepare it for analysis.
Power Query extension can help businesses to
- Streamline their data workflows.
- Extract data from multiple sources
- Improve data analysis capabilities for business.
Looking for the best Word Add-ins development company ?
For example, financial analysts may use Power Query to extract financial data from diverse sources, including market data feeds and accounting systems, and then sum up their resultant data in Excel to gain performance-related insights.
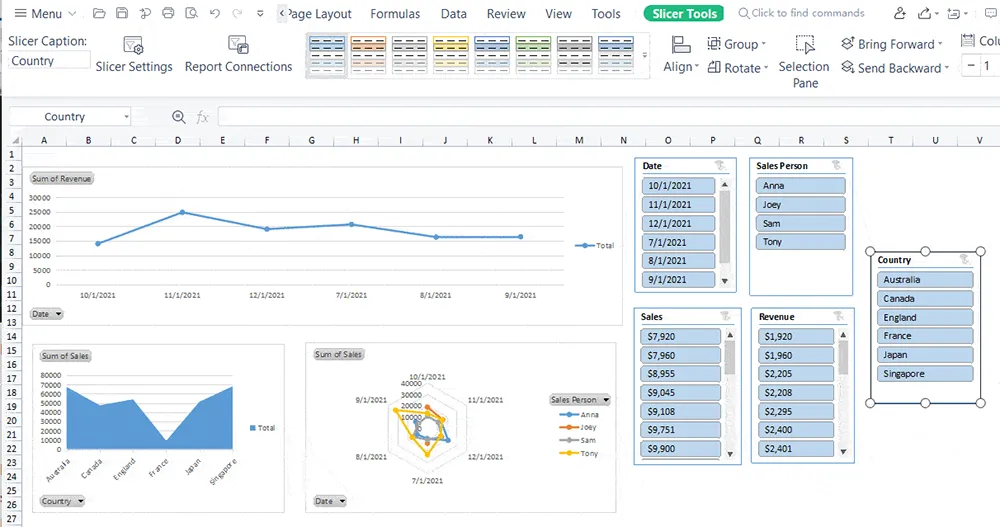
Look at the following figure to understand the role of power query in business data representation.
2. Datastream
Datastream is an Excel-based financial and economic database. Users may have access to a wide range of financial data through Datastream, including market statistics, corporate financials, economic indicators, and many more. Experts may use this data while conducting in-depth financial analyses on market trends, values, and risk management.
This eventually helps businesses gain a deeper understanding of the financial markets and make informed decisions in investments.
To understand with an example, a financial analyst may use Datastream to monitor market patterns and uncover investment possibilities that correspond with the business goals.
3. Power Pivot
Power Pivot is an Excel add-in that can be used to manage and analyze large datasets. With Power Pivot, users can import and merge data from various sources, create relationships between tables, and create powerful models for data analysis.
This tool is very useful in the financial industry when working with huge and complicated data sets such as trade data, market data, and financial statements. It enables financial analysts to effortlessly develop bespoke reports and dashboards that give real-time insights into their business performance.
4. Solver
Solver is another useful Excel add-in that can help businesses to optimize their decision-making processes. Solver is a powerful optimization tool that can be used to solve complex business problems, such as resource allocation, production planning, and supply chain optimization.
With Solver, users can define a set of constraints and objectives, and then find the best solution that meets those criteria.
Planning to hire dedicated ReactJS developers?
5. FRED (Federal Reserve Economic Data)
FRED (Federal Reserve Economic Data) is an Excel add-in that gives you access to a massive collection of economic data, such as major economic indicators, market movements, and economic projections. This information may be used to conduct detailed economic research and make sound judgments regarding investments and other financial activities.
Financial firms may use FRED to readily acquire and analyze vital economic statistics such as GDP, inflation rates, and unemployment rates in order to gain a better knowledge of the economic environment and make more educated decisions.
Moreover, financial professionals can access over 700,000 data series, including inflation rates, interest rates, GDP, and more, and use it to create custom charts and reports in Excel.
6. Excelmapper
Excelmapper is an Excel add-in that can be used to automate the process of importing and exporting data between Excel and other systems. With Excelmapper, users can easily map data fields between Excel and other systems, such as accounting systems, CRM systems, and trading systems.
This Add-on for Excel is extremely useful for organizations that need to:
- Move large amounts of data between systems.
- Simplify workflows.
- Minimize error risks.
- Automate tasks.
Moreover, this extension may also be used to automate other tasks, such as data validation and data cleansing, which can help to improve data quality and accuracy.
7. Financial Analysis Toolbox
Financial Analysis Toolbox is an Excel add-in that offers financial analysis and modeling tools for investment professionals.
With Financial Analysis Toolbox, financial experts can perform advanced calculations, such as
- Discounted cash flow
- Bond valuation
- Option pricing
- Excel Report generation.
The Financial Analysis Toolbox is a Microsoft Excel add-in that offers an array of financial analysis tools and functions. Financial firms may use this add-in to do a variety of financial calculations, such as calculating the net present value of investments, estimating cash flows, and analyzing financial statistics.
Key takeaway:
This tool is highly beneficial for financial analysts and investors who need to do extensive financial studies on massive datasets.
8. Data analysis toolpak Add-in for Excel
The aim of the Data Analysis Toolpak add-in is to provide additional data analysis tools that are not included in the standard Excel installation. And what tools does it provide? A wide range of statistical and analytical tools to help users analyze and manipulate data, including descriptive statistics, histograms, regression analysis, and hypothesis testing.
The data analysis approach used by financial experts is outlined below.
These tools are particularly useful for financial professionals, data analysts, and researchers who need to work with large data sets and perform complex calculations. The Data Analysis Toolpak can be accessed by enabling the add-in in Excel's options menu and then selecting it from the Data tab in the ribbon.
Embrace innovation and agility with our DOT NET development services!
9. Bloomberg Excel Add-in
Key takeaway:
This tool is best for investors and traders who need to make quick and informed decisions based on real-time market data. In addition, you may use it to create custom charts, tables, and reports in Excel.
10. Spreadsheet Compare
Key takeaway:
This tool is particularly useful for financial businesses that work with multiple versions of the same spreadsheet, as it can help to ensure data accuracy and consistency. .
11. Office Timeline
- Visualizing financial plans
- Simplifying complex financial information
- Track and identify potential issues
- Track milestones and deadlines
- Timelines and Gantt charts support
Key takeaway:
This application is perfect for financial analysts and project managers who need to present complicated financial data in an understandable and visually appealing manner.
So, these are the eleven most popular Excel add-ons that businesses should employ to improve their performance. Let us know what you think of these top-notch Add-ins for MS Excel! Do they improve your productivity?
Meanwhile, if you're looking for the best Excel addins development services, you can turn to us. Because we help you with market-leading Office 365 Add-ins development and Excel Add-ins development solutions that help you achieve your business goals.
Conclusion
Best Excel Add ins serve a key role in enhancing financial business efficiency. They continue to be a valuable tool for firms trying to increase their data analytic abilities. This article has highlighted the 11 best Excel addins that any finance and software development company should use for their purposes. By leveraging the power of this bespoke office add-in, companies can expedite their data operations, optimize their decision-making processes, and obtain deeper insights into their financial performance.
FAQs of Excel Add-in for finance
1. Is it safe to use spreadsheet add-ons?
Yes, spreadsheet add-ons are safe to use, using these small tools you can upgrade the functionality of Excel and do more.
2. What is the best Excel add-in for finance businesses?
There are multiple Excel add ins available for financial businesses however some of the most useful add-ins are Power Query, Power User, Solver, and Lucidchart which help to ease day-to-day work.
3. Are Excel add ins free to use?
You can find multiple Excel add ins that are totally free to use, however some add-ins require additional purchase. Need help? Hire office Add-in developer from iFour and get your requirements done.
11 Excel Add-ins that will transform your Financial Business Microsoft Excel is an extensively used tool in the financial business for doing sophisticated calculations, analyzing data, and producing business reports. Because standard Excel software can only help with basic operations, businesses require a platform that can extend Excel functionality and boost business productivity. This is where Excel add ins development comes into play. What is an Excel Add-in? Excel add-ins are software programs that extend the capabilities of Microsoft Excel across various platforms, including Mac and Windows, to make it more powerful, efficient, and user-friendly. These custom Excel Add-ins are created by software gurus who use scripting and advanced formulae to make them perform bizarre things. In this blog, we will discuss the top 11 Excel add-ins that financial experts and software developers can use to boost productivity and streamline their workflows. 1. Power Query Power Query is an Excel add-in that allows users to easily extract, transform, and load data from various sources. With Power Query, users can connect to a wide range of data sources, including databases, web pages, and files, and then clean and transform the data to prepare it for analysis. Power Query extension can help businesses to Streamline their data workflows. Extract data from multiple sources Improve data analysis capabilities for business. Looking for the best Word Add-ins development company ? Reach out us For example, financial analysts may use Power Query to extract financial data from diverse sources, including market data feeds and accounting systems, and then sum up their resultant data in Excel to gain performance-related insights. Look at the following figure to understand the role of power query in business data representation. 2. Datastream Datastream is an Excel-based financial and economic database. Users may have access to a wide range of financial data through Datastream, including market statistics, corporate financials, economic indicators, and many more. Experts may use this data while conducting in-depth financial analyses on market trends, values, and risk management. This eventually helps businesses gain a deeper understanding of the financial markets and make informed decisions in investments. To understand with an example, a financial analyst may use Datastream to monitor market patterns and uncover investment possibilities that correspond with the business goals. Read More: Top 15 Add-ons for Outlook to enhance data privacy and security 3. Power Pivot Power Pivot is an Excel add-in that can be used to manage and analyze large datasets. With Power Pivot, users can import and merge data from various sources, create relationships between tables, and create powerful models for data analysis. This tool is very useful in the financial industry when working with huge and complicated data sets such as trade data, market data, and financial statements. It enables financial analysts to effortlessly develop bespoke reports and dashboards that give real-time insights into their business performance. 4. Solver Solver is another useful Excel add-in that can help businesses to optimize their decision-making processes. Solver is a powerful optimization tool that can be used to solve complex business problems, such as resource allocation, production planning, and supply chain optimization. With Solver, users can define a set of constraints and objectives, and then find the best solution that meets those criteria. Key takeaway: This Office 365 Add-in is particularly useful for financial professionals who need to make strategic decisions based on complex data sets. For instance, a financial planner could use Solver to determine the optimal portfolio mix based on a set of risk and return criteria. Planning to hire dedicated ReactJS developers? Connect us Now 5. FRED (Federal Reserve Economic Data) FRED (Federal Reserve Economic Data) is an Excel add-in that gives you access to a massive collection of economic data, such as major economic indicators, market movements, and economic projections. This information may be used to conduct detailed economic research and make sound judgments regarding investments and other financial activities. Financial firms may use FRED to readily acquire and analyze vital economic statistics such as GDP, inflation rates, and unemployment rates in order to gain a better knowledge of the economic environment and make more educated decisions. Moreover, financial professionals can access over 700,000 data series, including inflation rates, interest rates, GDP, and more, and use it to create custom charts and reports in Excel. 6. Excelmapper Excelmapper is an Excel add-in that can be used to automate the process of importing and exporting data between Excel and other systems. With Excelmapper, users can easily map data fields between Excel and other systems, such as accounting systems, CRM systems, and trading systems. This Add-on for Excel is extremely useful for organizations that need to: Move large amounts of data between systems. Simplify workflows. Minimize error risks. Automate tasks. Moreover, this extension may also be used to automate other tasks, such as data validation and data cleansing, which can help to improve data quality and accuracy. Read More: A step-by-step guide on Excel Add-in development using React.js 7. Financial Analysis Toolbox Financial Analysis Toolbox is an Excel add-in that offers financial analysis and modeling tools for investment professionals. With Financial Analysis Toolbox, financial experts can perform advanced calculations, such as Discounted cash flow Bond valuation Option pricing Excel Report generation. The Financial Analysis Toolbox is a Microsoft Excel add-in that offers an array of financial analysis tools and functions. Financial firms may use this add-in to do a variety of financial calculations, such as calculating the net present value of investments, estimating cash flows, and analyzing financial statistics. Key takeaway: This tool is highly beneficial for financial analysts and investors who need to do extensive financial studies on massive datasets. 8. Data analysis toolpak Add-in for Excel The aim of the Data Analysis Toolpak add-in is to provide additional data analysis tools that are not included in the standard Excel installation. And what tools does it provide? A wide range of statistical and analytical tools to help users analyze and manipulate data, including descriptive statistics, histograms, regression analysis, and hypothesis testing. The data analysis approach used by financial experts is outlined below. These tools are particularly useful for financial professionals, data analysts, and researchers who need to work with large data sets and perform complex calculations. The Data Analysis Toolpak can be accessed by enabling the add-in in Excel's options menu and then selecting it from the Data tab in the ribbon. Embrace innovation and agility with our DOT NET development services! Connect us Now 9. Bloomberg Excel Add-in The Bloomberg Excel Add-in is a robust Excel add-in that gives real-time financial data from Bloomberg's massive database. Financial institutions may readily access up-to-date financial information, such as stock prices, market indices, news, and economic indicators, using this add-in. Key takeaway: This tool is best for investors and traders who need to make quick and informed decisions based on real-time market data. In addition, you may use it to create custom charts, tables, and reports in Excel. 10. Spreadsheet Compare Spreadsheet Compare is an Excel add-in that provides a range of tools for comparing and merging Excel spreadsheets. With this tool, financial businesses can easily compare two or more spreadsheets and identify any differences or inconsistencies. Key takeaway: This tool is particularly useful for financial businesses that work with multiple versions of the same spreadsheet, as it can help to ensure data accuracy and consistency. . Read More: How to use Angular for Office 365 Add-in development? 11. Office Timeline Office Timeline is an Excel add-in that allows you to create professional-looking timelines and Gantt charts. Financial firms may use this application to simply define timetables for financial initiatives such as budget planning and forecasting. Key benefits of office timeline Add-ons: Visualizing financial plans Simplifying complex financial information Track and identify potential issues Track milestones and deadlines Timelines and Gantt charts support Key takeaway: This application is perfect for financial analysts and project managers who need to present complicated financial data in an understandable and visually appealing manner. So, these are the eleven most popular Excel add-ons that businesses should employ to improve their performance. Let us know what you think of these top-notch Add-ins for MS Excel! Do they improve your productivity? Meanwhile, if you're looking for the best Excel addins development services, you can turn to us. Because we help you with market-leading Office 365 Add-ins development and Excel Add-ins development solutions that help you achieve your business goals. Conclusion Best Excel Add ins serve a key role in enhancing financial business efficiency. They continue to be a valuable tool for firms trying to increase their data analytic abilities. This article has highlighted the 11 best Excel addins that any finance and software development company should use for their purposes. By leveraging the power of this bespoke office add-in, companies can expedite their data operations, optimize their decision-making processes, and obtain deeper insights into their financial performance. FAQs of Excel Add-in for finance 1. Is it safe to use spreadsheet add-ons? Yes, spreadsheet add-ons are safe to use, using these small tools you can upgrade the functionality of Excel and do more. 2. What is the best Excel add-in for finance businesses? There are multiple Excel add ins available for financial businesses however some of the most useful add-ins are Power Query, Power User, Solver, and Lucidchart which help to ease day-to-day work. 3. Are Excel add ins free to use? You can find multiple Excel add ins that are totally free to use, however some add-ins require additional purchase. Need help? Hire office Add-in developer from iFour and get your requirements done. Infographic
Build Your Agile Team