×

iFour Logo

Performance Profiling in Visual Studio : VSTS Profiler

iFour Team - December 26, 2016

Listening is fun too.

Straighten your back and cherish with coffee - PLAY !

  • play
  • pause
  • pause
Performance Profiling in Visual Studio :  VSTS Profiler

POPULAR NODE.JS FRAMEWORKS FOR WEB APP DEVELOPMENT


­Performance profiling is defined as analysing the space and time complexity of any program in terms of software Engineering. In simple words, it helps improve performance of any program or software. Usually performance is based on two major factors, Time of execution and memory management. Microsoft has created Performance Profiler (VSTS Profile) build in Visual studio as a part of Visual Studio Team System(VSTS) and is capable of profiling every project created within Visual studio by custom software development companies.

Analysing the performance


In order to completely understand the concept of Performance profiling, we are going to create a Sample MVC application , then we can see how we can diagnose the overall performance of the website. The tool available in Visual Studio is Performance Wizard which generates a report, covering all the ways necessary for profiling by software development companies. These are as follows:

  • CPU Sampling
  • Instrumentation
  • .NET Memory allocation
  • Resource Contention

Let’s start by creating a sample application and check about the performance analyser, step by step

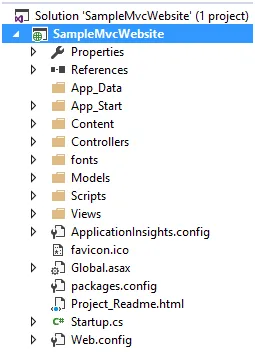
Step 1:  Create a simple MVC Project in Visual Studio and build the project without doing any changes.

Performance Profiling in Visual Studio

Step 2:  Change the Configuration Mode from Debug to Release

Visual Studio Performance Profiling Method

To report changes to Angular, the change detectors maintain track of the component's historical and current states as well as its structure.

When Angular receives a change detector report, it instructs the appropriate component to re-render and update the document object model (DOM).

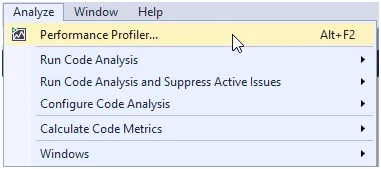
Step 3:  Go to Menu Analyze -> Performance Profiler

Method Performance Profiling in Visual Studio

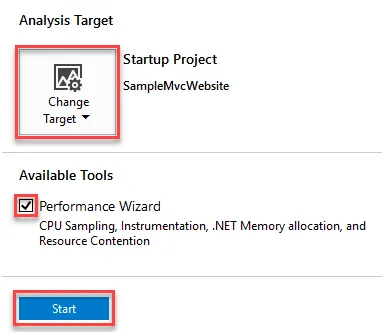
After selecting the menu, you will see the tools available for Analysing, select the Startup Project, check the Performance Wizard tool and finally click on Start button

Method of Performance Profiling Viual Studio

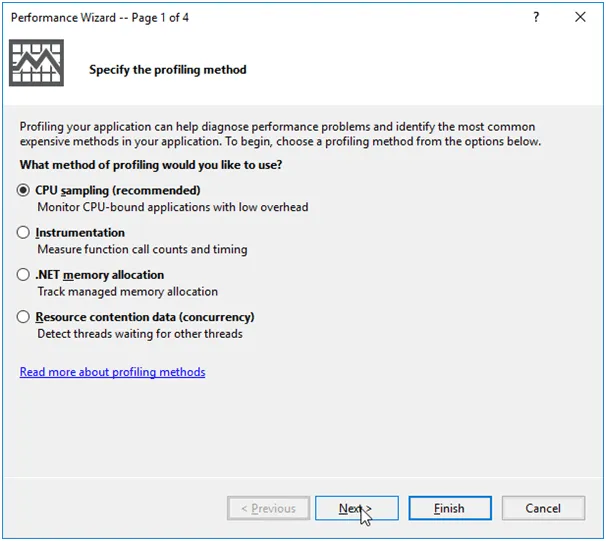
Step 4:  A Performance Wizard window will appear as below, In this steps, there are 4 different ways for profiling and each one has different purpose, for now, remained selected CPU Sampling and click on Next > button

Performance Profiling Method in Visual Studio

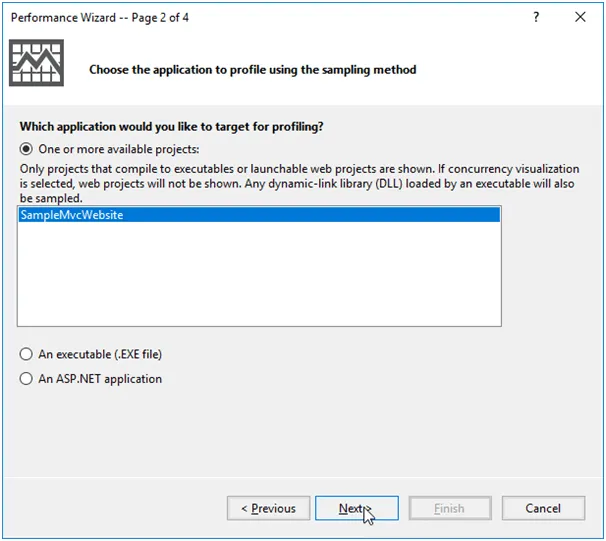
In the next window, you will see all the available Projects we have present in the solution, in our case it will be SampleMVCWebsite, the other option are An executable (.EXE file) and An ASP.NET application, as we want to profile for the complete project we keep our project selected and click on Next >

Visual Studio in Performance Profiling Method

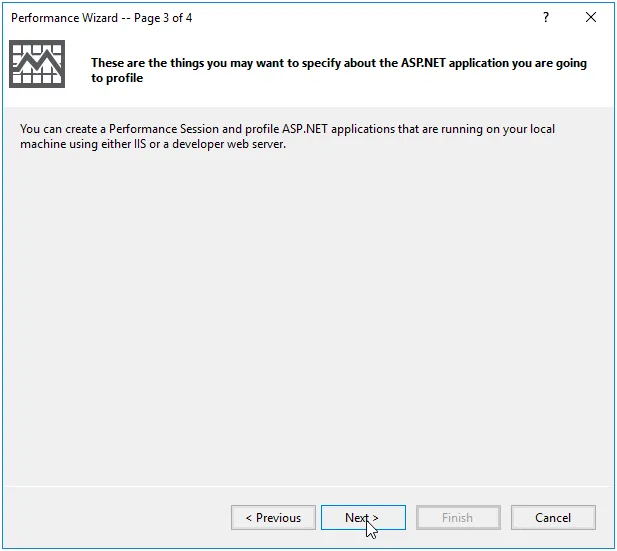
In next step, the Wizard will tell you that the performance session and profile will be shown either in IIS or development server, it is just an info window and we click on Next >

Performance Profiling Visual Studio .Net

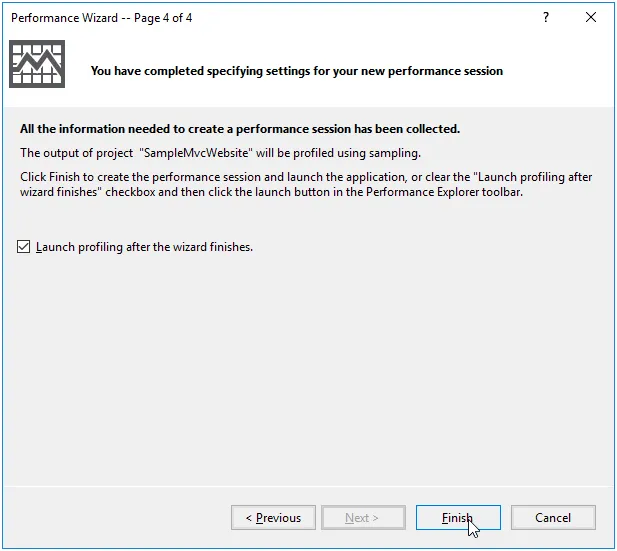
You have arrived to the final step of wizard, it is mentioned here that you have completed all the settings and that’s all, we finish the wizard by click on Finish button.

Visual Studio Dot Net Performance Profiling

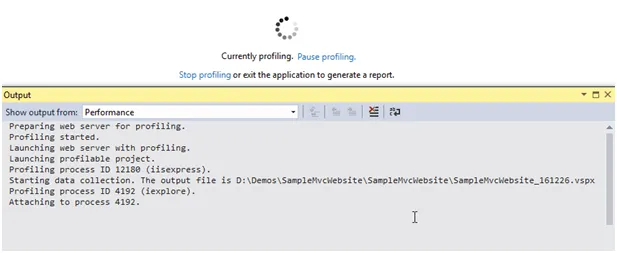
Step 5:  At this point the profiling has already begun, you can notice that the development server has already initialized, your browser has already loaded the website and profiling is on. You would notice below image in visual studio with an output window providing each step of the profiling. You can pause or stop the profiling during any time of the process.

Visual Studio Performance Profiling in Development

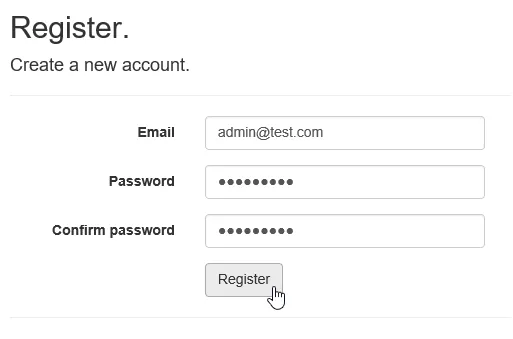
Step 6:  Go to browser where the website is loaded and browse /Account/Register of your website by clicking on register link on the top. Fill the form and complete all the validation necessary for the password strength and click on Register button.

Method of Performance Profiling in Visual Studio

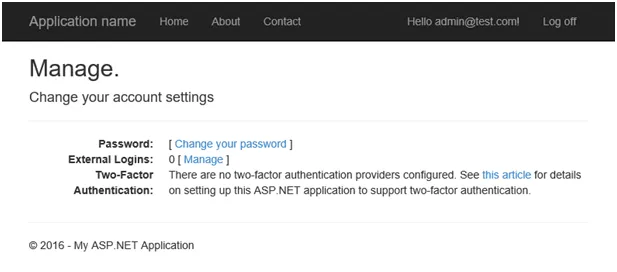
Now, go to your profile in the website and you will see the following details on the screen, you can change your password here and Manage external logins.

Dot Net Visual Studio Performance Profiling

Try changing password, after password is successfully changed, log off and close the browser window.

Step 7:  Go back to the Visual studio as soon as you close your browser. You notice that the report is starting to generate as image below. You can see the steps in the output window as it is collecting all the data required for generating report file (.vspx). It takes a few seconds to process all the records and display all the result in a window.

Performance Profiling Method in Visual Studio .Net

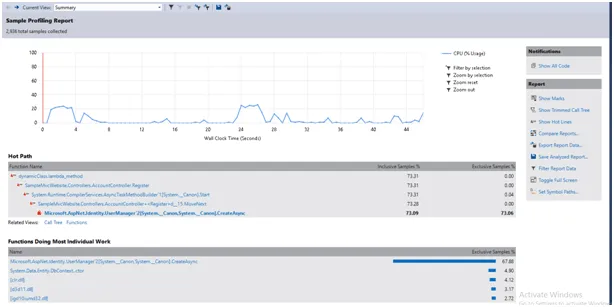
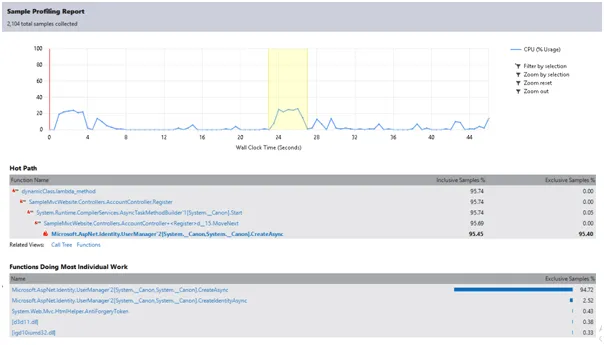
Step 8:  This is the step where you see the result of the process you have done in the browser, that is, Register, password change and log off. There is a graph which shows the CPU usage in Y axis and time taken for execution (in seconds) in X axis. During the whole process, you can analyse which part of the code is consuming how much CPU usage.

Visual Studio .Net Performance Profiling

You can see the CPU usage in depth, like the process where we have registered in the website, to do so you have to select the area in the graph and click on the “Filter by selection” link, just right side of the graph.

Performance Profiling in Visual Studio Dot Net

After filter selection, you can see the details of the area where we have clicked on the register process as below. The time between 23 seconds and 30 seconds is the time where the registration process is completed. We can analyse that the whole registration process took roughly about 4 seconds. You can see also the methods calls during this process below the graph and there Sample usage percentage during the registration and below that you can see the Individual functions performance

Performance Profiling in Visual Studio Development

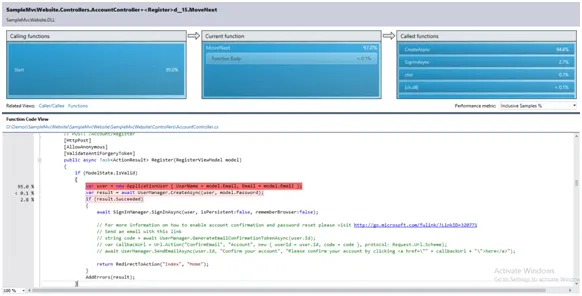
For Individual function performance, you can click on the selected “MoveNext” as below,

Performance Profiling in Visual Studio .Net


You have now reached the Function Details windows as below, here you can see the “Calling functions” à “Current Functions” à “Called functions” and below that the code which has executed during this process.

Calling function refers to the method from where the Registration part is started.

Current function refers to method body where all the registration process is happening.

Called functions refers to all other method which are going to be called in the Current function.

Called functions refers to all other method which are going to be called in the Current function.

You can click on the each method in the Called functions to see the details of that function and checkout the processes within that functions and so on until you reach end of the stack. Move forward or backward during whole process and their implementation and sampling all are reported within that section. You can even see the code section which is consuming all the CPU processes.

Performance Profiling in Visual Studio

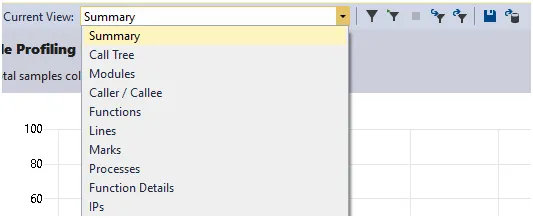
There are other windows available to see more in depth which you can see in the top dropdown box along with other options like filtering saving the report and export the report for future use.

Visual Studio Performance Profiling


And finally save the report to be used in next step. Reports are saved in Reports folder or you can view it in Performance Explorer.

One Stop Solution for Visual Studio Software Development - Enquire Today

Step 9:  All the Sampling data helps us determine the total performance of an application. After collecting data, you can easily optimize your code and re run all the steps necessary for profiling, review it, generate the report and save it in the same folder “Reports” where you have saved the previous sampling report. Select both old and new sample report and right click the selection and then Compare Performance Reports. After that, the comparison window shows the differences, performance regressions, and improvements that occurred from previous profiling to the new.

Summary


The Performance Profiling in Visual Studio is great tool for c# software development companies which helps to improve the project performance in day to day life activities and provides the best methods to analyse the problem. The most profitable thing is, everything is in Visual studio where code is written and analysed for performance issues. This tool provides the details of how and where to improve the performance in any application. Please note, the more profiling you do, the more improvement in application performance one sees.

Performance Profiling in Visual Studio : VSTS Profiler POPULAR NODE.JS FRAMEWORKS FOR WEB APP DEVELOPMENT ­Performance profiling is defined as analysing the space and time complexity of any program in terms of software Engineering. In simple words, it helps improve performance of any program or software. Usually performance is based on two major factors, Time of execution and memory management. Microsoft has created Performance Profiler (VSTS Profile) build in Visual studio as a part of Visual Studio Team System(VSTS) and is capable of profiling every project created within Visual studio by custom software development companies. Analysing the performance In order to completely understand the concept of Performance profiling, we are going to create a Sample MVC application , then we can see how we can diagnose the overall performance of the website. The tool available in Visual Studio is Performance Wizard which generates a report, covering all the ways necessary for profiling by software development companies. These are as follows: CPU Sampling Instrumentation .NET Memory allocation Resource Contention Let’s start by creating a sample application and check about the performance analyser, step by step Read More: Top 5 Free Visual Studio Extensions For Web Development Step 1:  Create a simple MVC Project in Visual Studio and build the project without doing any changes. Step 2:  Change the Configuration Mode from Debug to Release To report changes to Angular, the change detectors maintain track of the component's historical and current states as well as its structure. When Angular receives a change detector report, it instructs the appropriate component to re-render and update the document object model (DOM). Step 3:  Go to Menu Analyze -> Performance Profiler After selecting the menu, you will see the tools available for Analysing, select the Startup Project, check the Performance Wizard tool and finally click on Start button Step 4:  A Performance Wizard window will appear as below, In this steps, there are 4 different ways for profiling and each one has different purpose, for now, remained selected CPU Sampling and click on Next > button In the next window, you will see all the available Projects we have present in the solution, in our case it will be SampleMVCWebsite, the other option are An executable (.EXE file) and An ASP.NET application, as we want to profile for the complete project we keep our project selected and click on Next > In next step, the Wizard will tell you that the performance session and profile will be shown either in IIS or development server, it is just an info window and we click on Next > You have arrived to the final step of wizard, it is mentioned here that you have completed all the settings and that’s all, we finish the wizard by click on Finish button. Step 5:  At this point the profiling has already begun, you can notice that the development server has already initialized, your browser has already loaded the website and profiling is on. You would notice below image in visual studio with an output window providing each step of the profiling. You can pause or stop the profiling during any time of the process. Step 6:  Go to browser where the website is loaded and browse /Account/Register of your website by clicking on register link on the top. Fill the form and complete all the validation necessary for the password strength and click on Register button. Now, go to your profile in the website and you will see the following details on the screen, you can change your password here and Manage external logins. Try changing password, after password is successfully changed, log off and close the browser window. Step 7:  Go back to the Visual studio as soon as you close your browser. You notice that the report is starting to generate as image below. You can see the steps in the output window as it is collecting all the data required for generating report file (.vspx). It takes a few seconds to process all the records and display all the result in a window. Step 8:  This is the step where you see the result of the process you have done in the browser, that is, Register, password change and log off. There is a graph which shows the CPU usage in Y axis and time taken for execution (in seconds) in X axis. During the whole process, you can analyse which part of the code is consuming how much CPU usage. You can see the CPU usage in depth, like the process where we have registered in the website, to do so you have to select the area in the graph and click on the “Filter by selection” link, just right side of the graph. After filter selection, you can see the details of the area where we have clicked on the register process as below. The time between 23 seconds and 30 seconds is the time where the registration process is completed. We can analyse that the whole registration process took roughly about 4 seconds. You can see also the methods calls during this process below the graph and there Sample usage percentage during the registration and below that you can see the Individual functions performance For Individual function performance, you can click on the selected “MoveNext” as below,   You have now reached the Function Details windows as below, here you can see the “Calling functions” à “Current Functions” à “Called functions” and below that the code which has executed during this process. Calling function refers to the method from where the Registration part is started. Current function refers to method body where all the registration process is happening. Called functions refers to all other method which are going to be called in the Current function. Called functions refers to all other method which are going to be called in the Current function. You can click on the each method in the Called functions to see the details of that function and checkout the processes within that functions and so on until you reach end of the stack. Move forward or backward during whole process and their implementation and sampling all are reported within that section. You can even see the code section which is consuming all the CPU processes. There are other windows available to see more in depth which you can see in the top dropdown box along with other options like filtering saving the report and export the report for future use.   And finally save the report to be used in next step. Reports are saved in Reports folder or you can view it in Performance Explorer. One Stop Solution for Visual Studio Software Development - Enquire Today See here Step 9:  All the Sampling data helps us determine the total performance of an application. After collecting data, you can easily optimize your code and re run all the steps necessary for profiling, review it, generate the report and save it in the same folder “Reports” where you have saved the previous sampling report. Select both old and new sample report and right click the selection and then Compare Performance Reports. After that, the comparison window shows the differences, performance regressions, and improvements that occurred from previous profiling to the new. Summary The Performance Profiling in Visual Studio is great tool for c# software development companies which helps to improve the project performance in day to day life activities and provides the best methods to analyse the problem. The most profitable thing is, everything is in Visual studio where code is written and analysed for performance issues. This tool provides the details of how and where to improve the performance in any application. Please note, the more profiling you do, the more improvement in application performance one sees.

Build Your Agile Team

Enter your e-mail address Please enter valid e-mail

Categories

Ensure your sustainable growth with our team

Talk to our experts
Sustainable
Sustainable
 
Blog Our insights
Power Apps Solving 13 Legal Challenges

There is a common misconception that bringing technology into the legal field won't be effective as this profession relies heavily on evidence and facts. However, if you look at it...

How to Automate Power BI Reports Using Power Automate

"Does Power Automate work with Power BI?”. If you think the same, you’re at the right place. Manual reporting plays an important role in business decision-making but requires more...

What’s New in .NET 9?

Today, we’re thrilled to present you with the first glimpse of .NET 9 release and let you know what features and updates you can anticipate in this new version. Various professionals believe that it’s the right time to explore and adopt the latest version of .NET for your upcoming projects. It is even recommended for projects built using .NET 6 or .NET 8, due to the framework updates made in this version.