What’s New in ASP.NET Core 10 – Key Features & Expert Insights
We tracked the evolution of .NET 9 on Reddit, and watched the heated debates on .NET 6 vs .NET 8. And just when we thought that things had finally settled, Microsoft drops another...
Listening is fun too.
Straighten your back and cherish with coffee - PLAY !
Power BI and Looker are two popular data analytics and business intelligence technologies that help businesses improve their process and gain data-driven insights for better decision-making. With each technology being popular with tremendous features inside, choosing one from these can be a challenging task. To do this, we need to conduct an in-depth analysis of Looker vs Power BI right from their features and pricing to advantages and their limitations. That’s what we are going to discuss in this article.
Looker is a data analytics platform that helps C-level executives in providing data simply and intuitively. Users can explore and share findings from various data sources without any technical expertise. The easy-to-use interface enables users to effortlessly generate custom dashboards, reports, and visual representations. Looker facilitates collaborative analytics, enabling groups to exchange perspectives and monitor alterations instantly.
Power BI a data analysis and visualization tool enables you to design interactive dashboards and reports, can connect to multiple data sources, and transform data. Its intuitive interface allows easy exploration and interpretation of data. Power BI supports collaboration through sharing and real-time updates. With customizable dashboards and robust security measures, organizations can derive actionable insights and make informed decisions.
In the Google Looker vs Power BI comparison, Looker holds a smaller market share compared to Power BI. Google Looker has 1.84% of the market share in the data visualization category. Despite this, Looker is highly valued for its robust data modeling and analytics capabilities. It is particularly favored by enterprises with complex data needs.
Looker vs Power BI - market share
Power BI holds a significant market share of 16.15% in the data analysis tools category. Power BI is a Microsoft tool, and due to its smooth integration with Microsoft products, it has a large user base. Moreover, Power BI is significantly secure compared to other tools making it a go-to choice for everyone.
Have a quick glance at the key differences between Google Looker and Power BI.
| Factors | Power BI | Looker |
|---|---|---|
| Targeted Audience: | Business users and data analysts. | Primarily data analysts and developers. |
| Focus: | User-friendliness, drag-and-drop interface | Advanced analytics, data governance, customization. |
| Data Source Connectivity: | Extensive support for various data sources. | Primarily cloud-based data sources, some on-premises. |
| Data Modeling: | Less complex, user-friendly model building. | More complex, code-based model building. |
| Visualization: | Wide variety of charts and graphs. | More customizable visualizations, the potential for code use. |
| Collaboration: | Easy sharing and collaboration within the organization. | Git integration for version control and collaboration. |
| Pricing: | Subscription-based pricing model. | Subscription-based pricing model, with potential for higher costs for complex deployments. |
Even though both tools are used for the same purpose their functionalities differ from each other. Let’s have a look at the feature differences between Looker and Power BI.
Take a look at these prime Power BI use cases we've crafted for our industry CTOs. These BI examples helped them simplify their operational decisions!
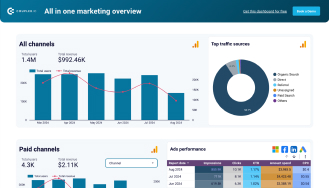
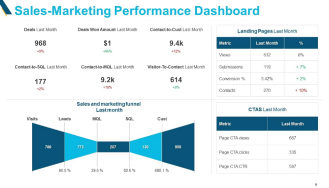
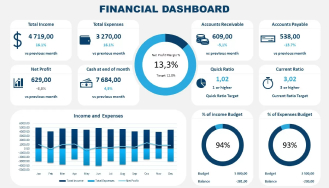
These are the key differences in Google Looker vs Power BI that we can take into consideration. After considering the features comparison, let’s point out the advantages and disadvantages of using these tools.
Here is the table showing the advantages of Google Looker and Power BI.
| Google Looker | Power BI |
|---|---|
| Looker platform has many chart styles and ways to present data. | It has drag-and-drop capabilities allowing you to copy formatting across visualization easily. |
| It has a user-friendly platform that offers real-time analysis to monitor progress constantly. | It has robust sharing capabilities that allow users to distribute reports and dashboards with partners easily. |
| Looker allows you to create customized dashboards with drag-and-drop functionality to change visualizations as per your business needs and preferences. | Power BI includes powerful data preparation tools that help users clean and transform their data before analysis. |
| Google Looker easily integrates with many Google services like Google Ads, Google Display, Google Analytics, Big Query, and YouTube Analytics. | Power BI easily integrates with Microsoft products like Excel, Azure, and Office 365, increasing data connectivity and workflow efficiency. |
| With Looker, you can get access to a wide range of data sources. | Users can manage data easily without any extensive training. |
Let’s delve into the limitations of Looker vs Power BI.
| Google Looker | Power BI |
|---|---|
| While working on a large project with Looker you might face lagging issues. | As it is a Microsoft platform, it is expensive for some companies. |
| Very limited resources for customer support. | It is not an open-source solution provider. |
| It takes too much time for reports to load on the platform. | It has data size limitations which can be restrictive for analyzing large datasets. |
| Unfortunately, Looker does not run in offline mode causing a drawback for users to work remotely. | Power BI depends significantly on internet connectivity to access and share data, creating drawbacks for users with unstable internet access. |
| The integration with other system software can be somewhat complex and challenging. | Integrating Power BI with certain third-party applications and systems can be complex and may require additional tools. |
After considering the advantages and disadvantages of Looker and Power BI, we must check out the pricing differences. Both tools avail subscription-based pricing models which can be customized based on the organization's needs like the number of users, type of deployment, and volume of data. Let’s compare Looker vs Power BI pricing structures.
It has a subscription-based pricing model that changes based on the usage, extra features, and user count. Looker doesn’t provide information about its pricing plan on its website, nevertheless, you can contact the sales team to get a pricing quotation. Get more pricing-related info here.
Power BI offers three basic pricing options such as;
Cost: The Power BI desktop is free to use.
Description: A standalone BI tool for individual users to create reports and visualizations.
Cost: The Power BI pro plan starts at $10 per user per month.
Description: Includes all features of Power BI desktop plus collaboration, sharing, and analysis capabilities.
Cost: The premium plan starts at $20 per user per month.
Description: Designed for enterprise-scale deployments, includes advanced features like paginated reports, AI, and greater data capacity.
Cost: The Power BI desktop is free to use.
Description: A standalone BI tool for individual users to create reports and visualizations.
| Comparison Factors | Looker | Power BI |
|---|---|---|
| Initial Cost: | High initial cost due to the subscription-based model. | Lower initial cost with the free desktop version and affordable pro licenses. |
| Scalability: | Expensive to scale due to higher subscription costs for additional users and data. | More cost-effective scalability, especially with premium capacity options. |
| Total Cost of Ownership: | Generally higher due to the comprehensive enterprise features and customizability. | Considerably lower, especially for small to mid-scale businesses due to affordable pricing tiers. |
Let’s conclude which is better, Power BI or Looker. When we consider Looker vs Power BI, the choice depends on the organization's specific needs. Power BI can be an ideal solution for small to mid-scale businesses because it is typically more affordable and smoothly integrates with Microsoft services. Looker is better suited for large enterprises with complicated data requirements because of its robust enterprise features and excellent data modeling capabilities.
Want to transform your data into captivating insights? Get Power BI consulting services from iFour . We have a team of Power BI experts with enough expertise in the field to help you transform your business digitally. Our Power BI experts are highly proficient in creating interactive dashboards to help you track business performance in real-time.
Our team holds enough expertise in the field to help you transform your business digitally. Our Power BI experts are highly proficient in creating interactive dashboards to help you track business performance in real-time. Connect with us today to improve your business intelligence strategies.
(Turning insights into various data visualizations)
A BI solution should offer data visualization and reporting features to obtain real-time analysis and actionable insights. It should also offer custom dashboards and smooth integration with different data sources.
Power BI cannot be connected to Looker, but data can be exported from Looker and then loaded into Power BI for analysis. Common data formats like CSV or APIs can be used for this.
Power BI is the Microsoft version of Google Looker. It provides comprehensive data visualization, business analytics, and reporting capabilities similar to Looker. Both platforms provide tools for transforming raw data into actionable insights through interactive dashboards and reports.
Numerous data sources like business datasets, cloud services, and online platforms like Salesforce and Google Analytics are compatible with Power BI. It also supports various file formats such as Excel, CSV, and JSON, enabling seamless integration with diverse data sources. Additionally, Power BI offers connectivity through APIs and custom connectors for extending compatibility to specialized systems.
Looker and Power BI both have advantages and disadvantages such as Looker is particularly strong at data modeling and customization, whereas Power BI is known for its intuitive user interface and tight integration with Microsoft products. Hence the choice depends on what matters for your organization.
Looker is used by businesses to transform raw data into insightful understanding that facilitates information to be understood and acted upon. Its customizable features and centralized platform expedite data analysis and decision-making procedures for better business outcomes.
Looker is a business intelligence platform that enables businesses to analyze, visualize, and report data for making informed decisions. It offers advanced features for data modeling, exploration, and collaboration.
This eBook shows you how.
We tracked the evolution of .NET 9 on Reddit, and watched the heated debates on .NET 6 vs .NET 8. And just when we thought that things had finally settled, Microsoft drops another...
Several experts, particularly those just starting out, often find themselves confused about WPF and UWP, wondering if they are the same. Since they are used to create great UIs for...
Many companies rely on advanced technologies to make informed decisions in their business. For instance, some Chief Technology Officers (CTOs) turn to Power BI consulting services,...