


How to Do Forecasting in Power BI (Steps & Accuracy Metrics)
Remember our last guide - Power BI forecasting? It revealed things that truly blocks accuracy, both structural and situational. Now it's time to take the next step. Knowing Power...

601 & 612, The Times square Arcade, Near Baghban party plot, Thaltej - Shilaj Road, Thaltej, Ahmedabad, Gujarat - 380059
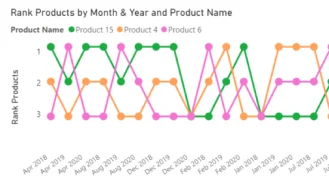
The Bump Chart by iFour makes it easy to see how the position or rank of items like salespeople, products, or regions changes over time. Instead of showing actual numbers, it focuses on who is leading and who is falling behind. With smooth lines and animations, you can quickly spot trends and understand shifts in performance. It is a clear and engaging way to tell stories with your data.
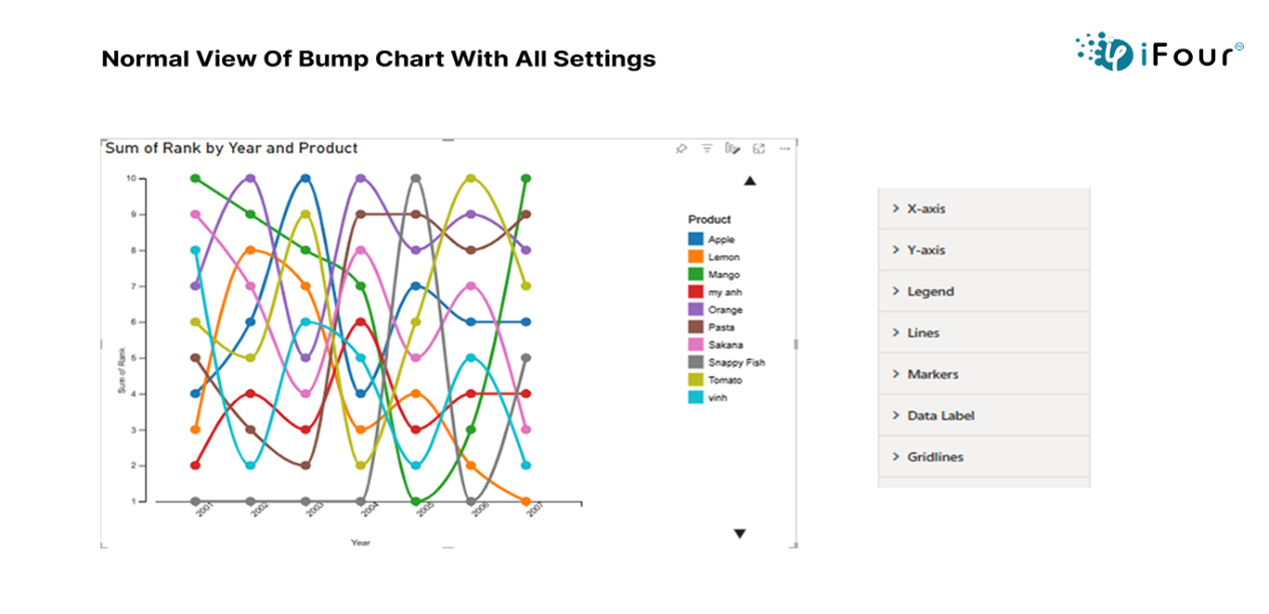
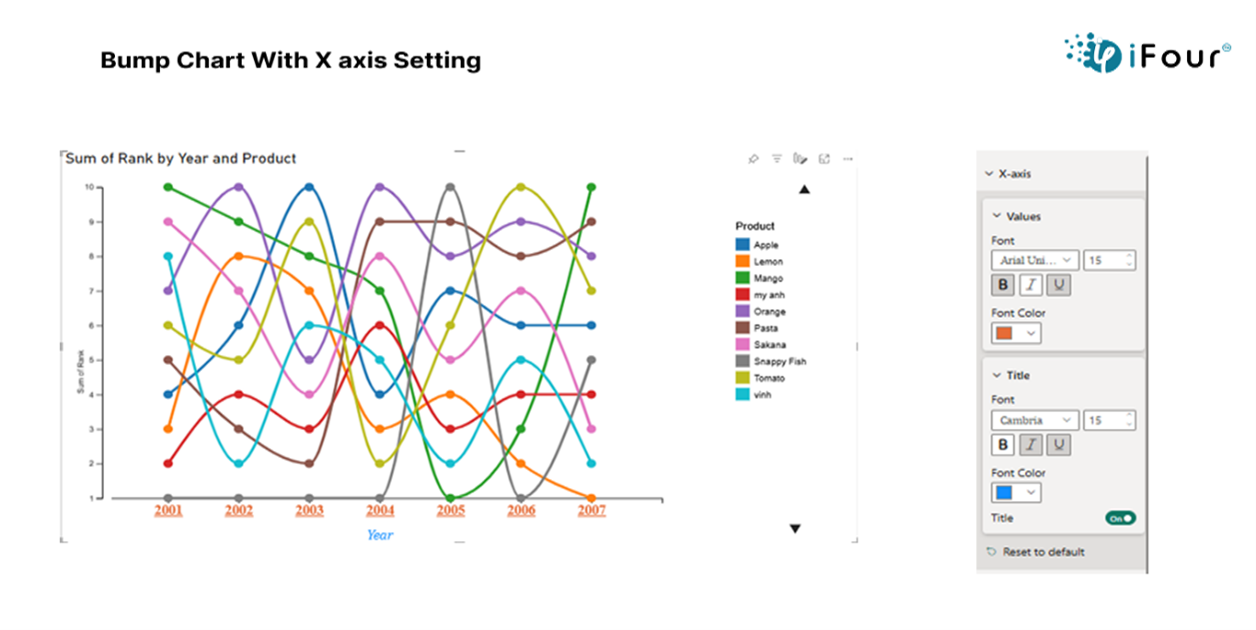
X-Axis: Customize font size,and color for better readability.
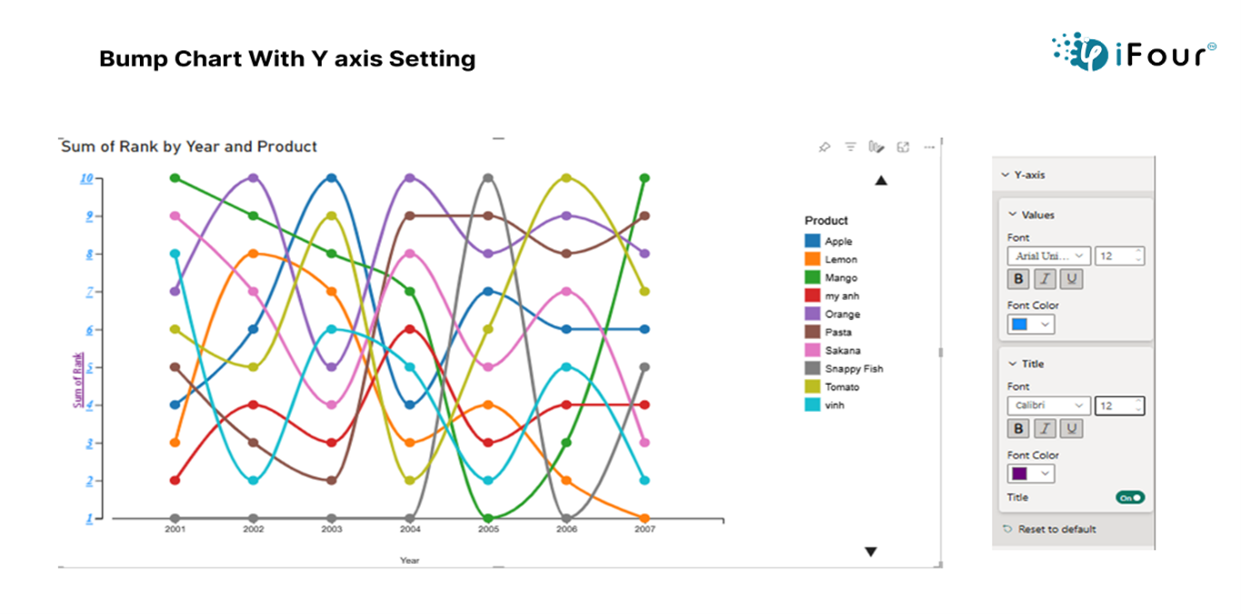
Y-Axis: Adjust font settings to suit data representation needs.
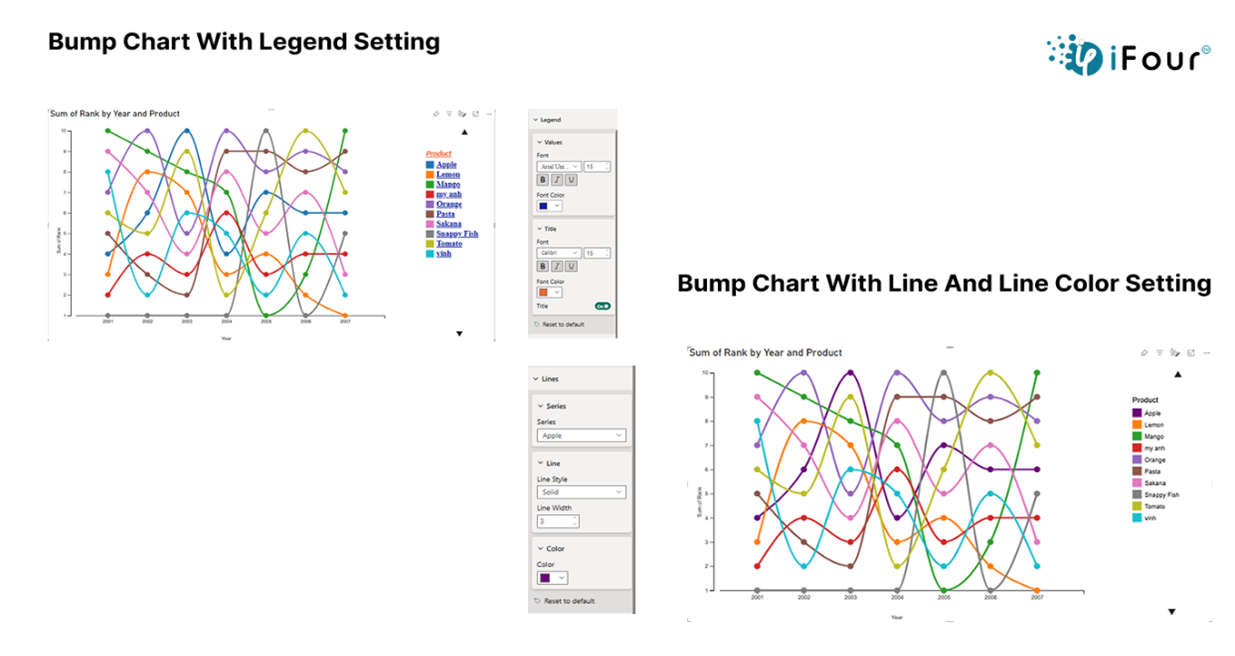
Legend: Modify legend text style for clear data series identification.
Line: Change line thickness, style, and color dynamically based on data.
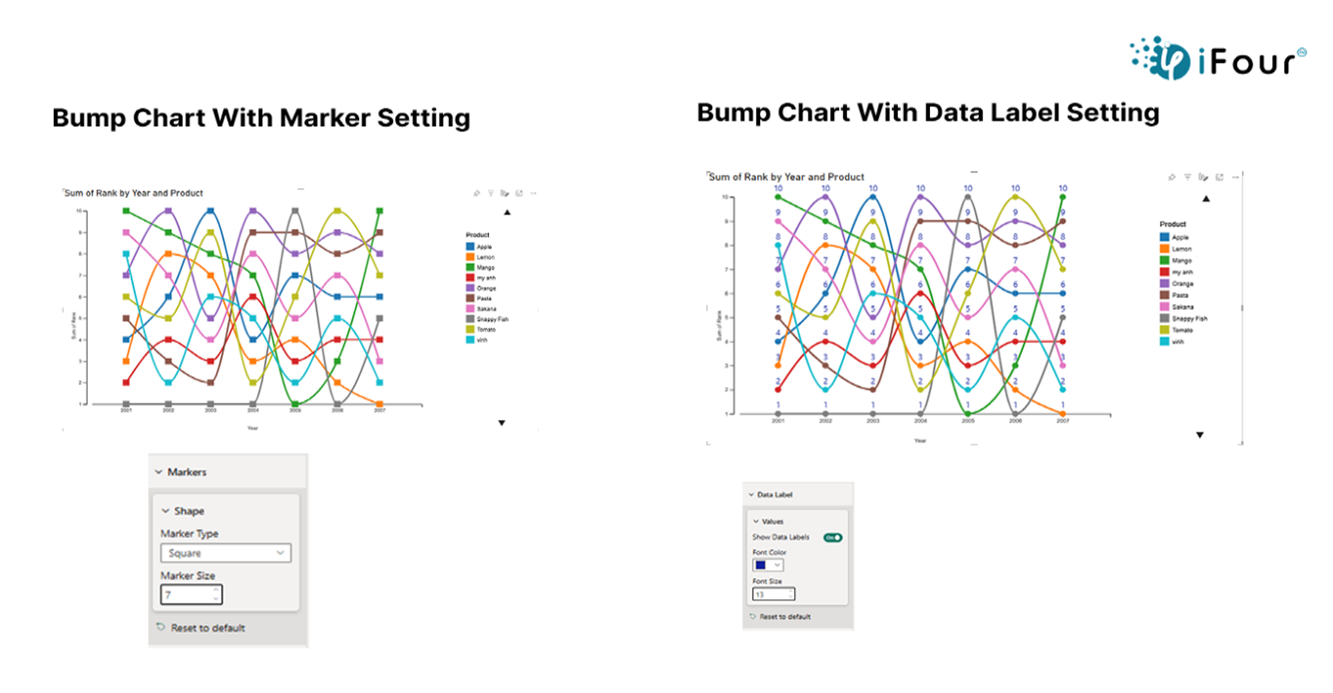
Marker: Select shapes, resize, and apply custom colors to markers.
Data Label: Toggle visibility and style of data labels directly on the chart.
Gridlines: Enable/disable, style, and color gridlines to match the theme.
See how we've transformed businesses with Azure cloud solutions
In healthcare, a Bump Chart tracks how different departments like cardiology and emergency rank over time based on patient volume, resource usage, or treatment success rates. Hospital administrators can easily monitor which departments are becoming busier or improving performance, helping them make better staffing, budgeting, and planning decisions.
Interactive, animated bump chart visuals
Clear tracking of position changes across time
Exportable and mobile-friendly designs
Easy integration into Power BI dashboards and presentations.
Here are a few examples to help you easily understand how it can be used.
| Industry | Use Cases |
|---|---|
| Finance | Asset class rankings over different quarters |
| Healthcare | Departmental performance rankings by month |
| Marketing | Top-performing campaigns over various timeframes |
| Retail | Monthly ranking of best-selling products |
| Education | Department wise student performance trends |
1. Download from AppSource or import into Power BI. Click to download
2. Add Bump Chart visual to your Power BI report canvas.
3. Map the required fields:
->Time (e.g., month, quarter, year)
-> Category (e.g., salesperson, product)
-> Value (used for ranking)
4. Customize settings such as axis order, line thickness, and animation speed.
5. Style with your preferred color themes and data labels.
6. Enhance insights with slicers, filters, and bookmarks.


iFour Technolab specializes in Power BI consulting company , providing dashboard development services to various industries like fintech, healthcare, legal and so on.
We are a Microsoft Solutions Partner in “Data & AI” and “Digital & App Innovation”, ISO 9001:2015 and ISO 27001 certified. With global presence in the USA, Netherlands, Australia, and India, we deliver custom AI-driven software and cloud solutions.
We house 7 certified SCRUM Masters and over 120 skilled engineers led by an experienced management team.
Our industry focus includes legal, fintech, and healthcare, with a portfolio of impactful custom visuals on Microsoft AppSource—Step Chart, Animated Treemap, Hat Graph, and now, Bump Chart—each built for intuitive, insight-driven analytics.


(Empowering industries with data-driven visuals)
+1 410 892 1119 / +91 95375 81301


![]()


Yes, you can use data labels or tooltips to display both actual values and their rankings.
Yes, the visual support Power BI’s export features, including PDF, PowerPoint, and image formats.
Yes, hovering over a point will show tooltips with details like category, rank, and value.
Yes, use filters or DAX logic to restrict the default view to top N items.
While not built-in, you can place background elements behind the chart using Power BI shapes or images.
Yes, you can adjust line width and marker size in the formatting pane to match your visual style.
iFour regularly updates its visuals on AppSource. You’ll receive updates automatically via Power BI when a new version is released.
Definitely. Our expert team can help tailor the visual to your unique needs.
")
Remember our last guide - Power BI forecasting? It revealed things that truly blocks accuracy, both structural and situational. Now it's time to take the next step. Knowing Power...

Did you know that 70% of CTOs (Chief Technology Officers) hesitate to adopt Microsoft Power BI because of its myths and misconceptions that float around. What they fail to see is...

Every CTO knows the struggle of managing complex reports. The inefficiency of scattered data, the constant juggling between reporting tools, the challenge of ensuring accurate KPIs...
