


How to Do Forecasting in Power BI (Steps & Accuracy Metrics)
Remember our last guide - Power BI forecasting? It revealed things that truly blocks accuracy, both structural and situational. Now it's time to take the next step. Knowing Power...

601 & 612, The Times square Arcade, Near Baghban party plot, Thaltej - Shilaj Road, Thaltej, Ahmedabad, Gujarat - 380059
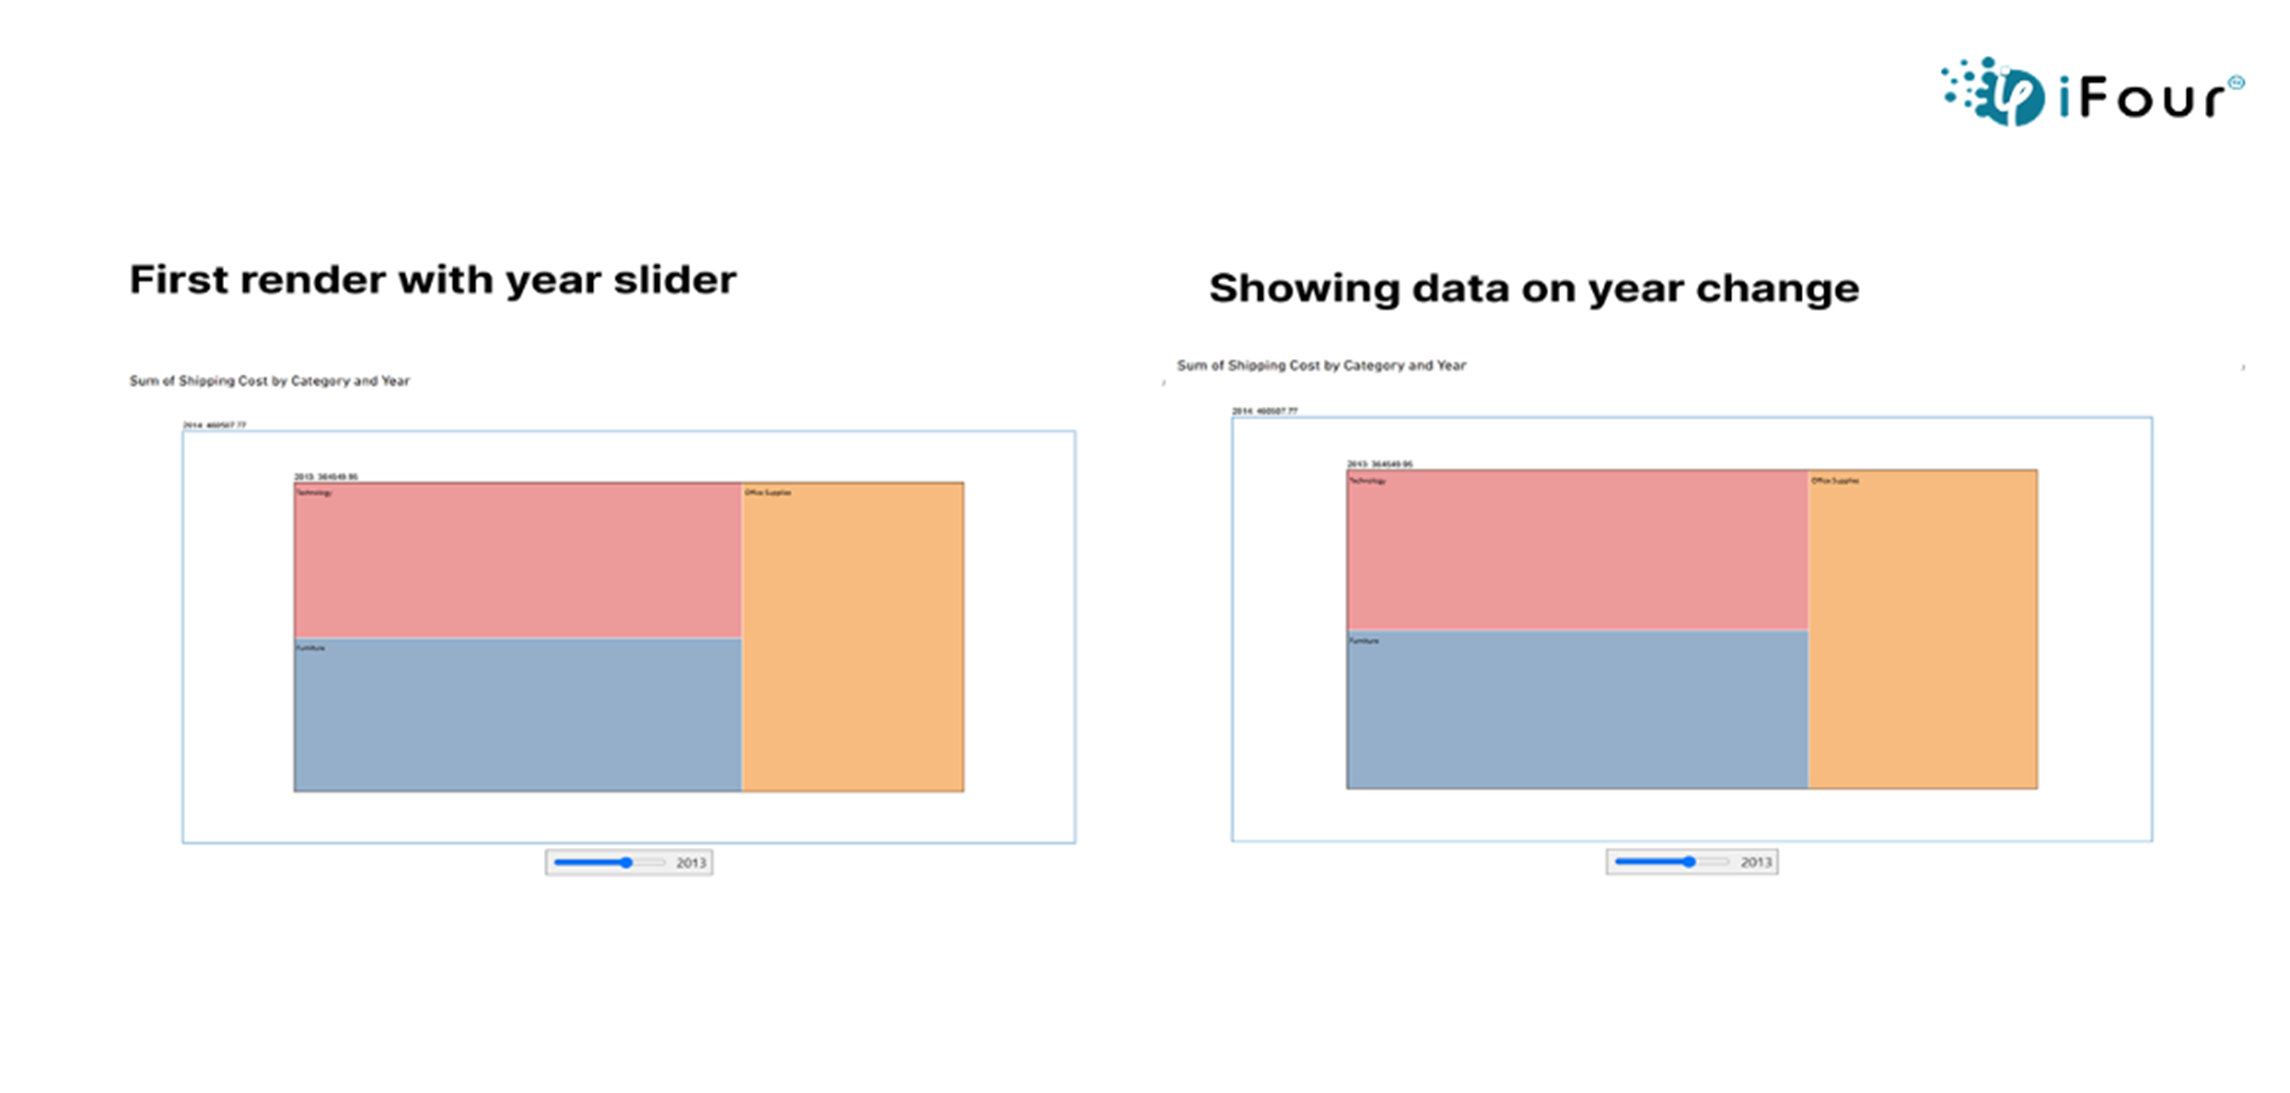
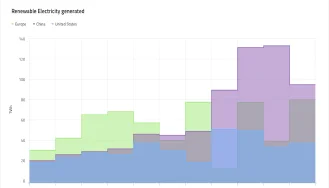
Animated Treemap helps you see not just the structure of the data, but also how it changes over time. With smooth animations, you can effortlessly observe trends and track how each category expands or declines over time. It is a simple and engaging way to explore complex data with many layers. This makes your reports, dashboards, and project updates much clearer and more appealing.
Dynamic animations showing changes in data
Hierarchical groupings with customizable depth
Smooth transitions between filtered views
Customizable color palettes and gradient options
Label formatting and responsive positioning
Cross-filtering and drill-through support
High performance with large datasets
Power BI themes and bookmarks compatibility
See how we've transformed businesses with Azure cloud solutions
An Animated Treemap can be used in finance to track the performance of different investment sectors over time. A financial firm can display the share of stocks, bonds, and real estate in a portfolio, showing how their values rise and fall. This helps investors easily spot trends, monitor shifts in asset allocation, and make faster, informed investment decisions.
Dynamic, animated treemap visualizations
Smooth transitions to highlight data changes
Exportable, filter-aware, and interactive charts
Smooth integration into Power BI dashboards and reports
Here are a few examples to help you easily understand how it can be used.
| Industry | Use Cases |
|---|---|
| Finance | Year-over-year revenue growth by region |
| Healthcare | Resource allocation changes across units |
| Marketing | Campaign impact by channel and timeframe |
| Retail | Sales volume shifts by product category |
| Education | Student enrollment trends over semesters |


iFour Technolab is a leading Power BI consulting company, providing dashboard development services to various industries like fintech, healthcare, legal and so on.
We are a Microsoft Solutions Partner certified in “Data & AI”, “Infrastructure Azure”, and “Digital & App Innovation”, and a certified ISO 9001:2015 and ISO 27001 company.
Our expertise lies in custom AI-driven solutions, advanced analytics, and cloud services. We have offices in the USA, Netherlands, Australia, and India.
Our development center is empowered with 7 SCRUM Masters and more than 120 highly qualified software engineers led by a management team with over 20 years of industry experience. Our primary industry focus areas are legal, fintech, and healthcare.
Our contributions to Microsoft AppSource include custom Power BI visuals like Step Chart, Bump Chart, Animated Treemap, and Hat Graph—each crafted to simplify complex data and support smarter decision-making.


(Empowering industries with data-driven visuals)
+1 410 892 1119 / +91 95375 81301


![]()


Unlike a static treemap, the animated version visually shows how data grows, shrinks, or shifts over a period.
Yes, it is designed to handle large and complex datasets efficiently.
Any hierarchical data that changes over time like sales by region, expenses by department, or market share by company.
No, it is optimized to perform smoothly even with big datasets.
Yes, Animated Treemap works in Power BI Desktop, service, and embedded environments.
Yes, it automatically adjusts to mobile view for better readability on small screens.
You can simply link the time field (like year, month, or quarter) to the visual, and it animates through those periods.
Yes, you can add and configure multiple instances based on different datasets and views.
You can contact us for any customization requirements. Our team will work closely with you to understand your goals and provide the right solution.
")
Remember our last guide - Power BI forecasting? It revealed things that truly blocks accuracy, both structural and situational. Now it's time to take the next step. Knowing Power...

Did you know that 70% of CTOs (Chief Technology Officers) hesitate to adopt Microsoft Power BI because of its myths and misconceptions that float around. What they fail to see is...

Every CTO knows the struggle of managing complex reports. The inefficiency of scattered data, the constant juggling between reporting tools, the challenge of ensuring accurate KPIs...
